Species Abundance Distribution#
The species abundance distribution (SAD) records the abundance of each species in a community (or sample of that community). The SAD is therefore central to biodiversity studies where the aim is to quantify changes in the number and relative abundance of species in a community, where abundance refers to the number of individuals recorded for a given species. In fact, the numerous approaches to summarizing the biodiversity of communities are simply different ways to quantify various aspects of the SAD (see below). When a histogram of the number of species in each abundance bin is plotted on a linear scale, a characteristic hyperbolic curve is produced (Fig. 69a). This is characteristic of all known biological communities and is therefore considered a universal law of ecology [McGill et al., 2007]. When abundances are log transformed (log base 2 is typically chosen so that abundances are grouped in doubling classes) the SAD shows more variability with some communities following a normal curve (often rightward skewed; see log-normal distribution) while others exhibit multiple modes (Fig. 69b). The most common way to display species abundances distributions is the rank abundance distribution (RAD) (Fig. 69c). In this case species are ranked from lowest to highest by their abundance on the x-axis and log-transformed abundance (usually log base 10) is plotted on the y-axis.
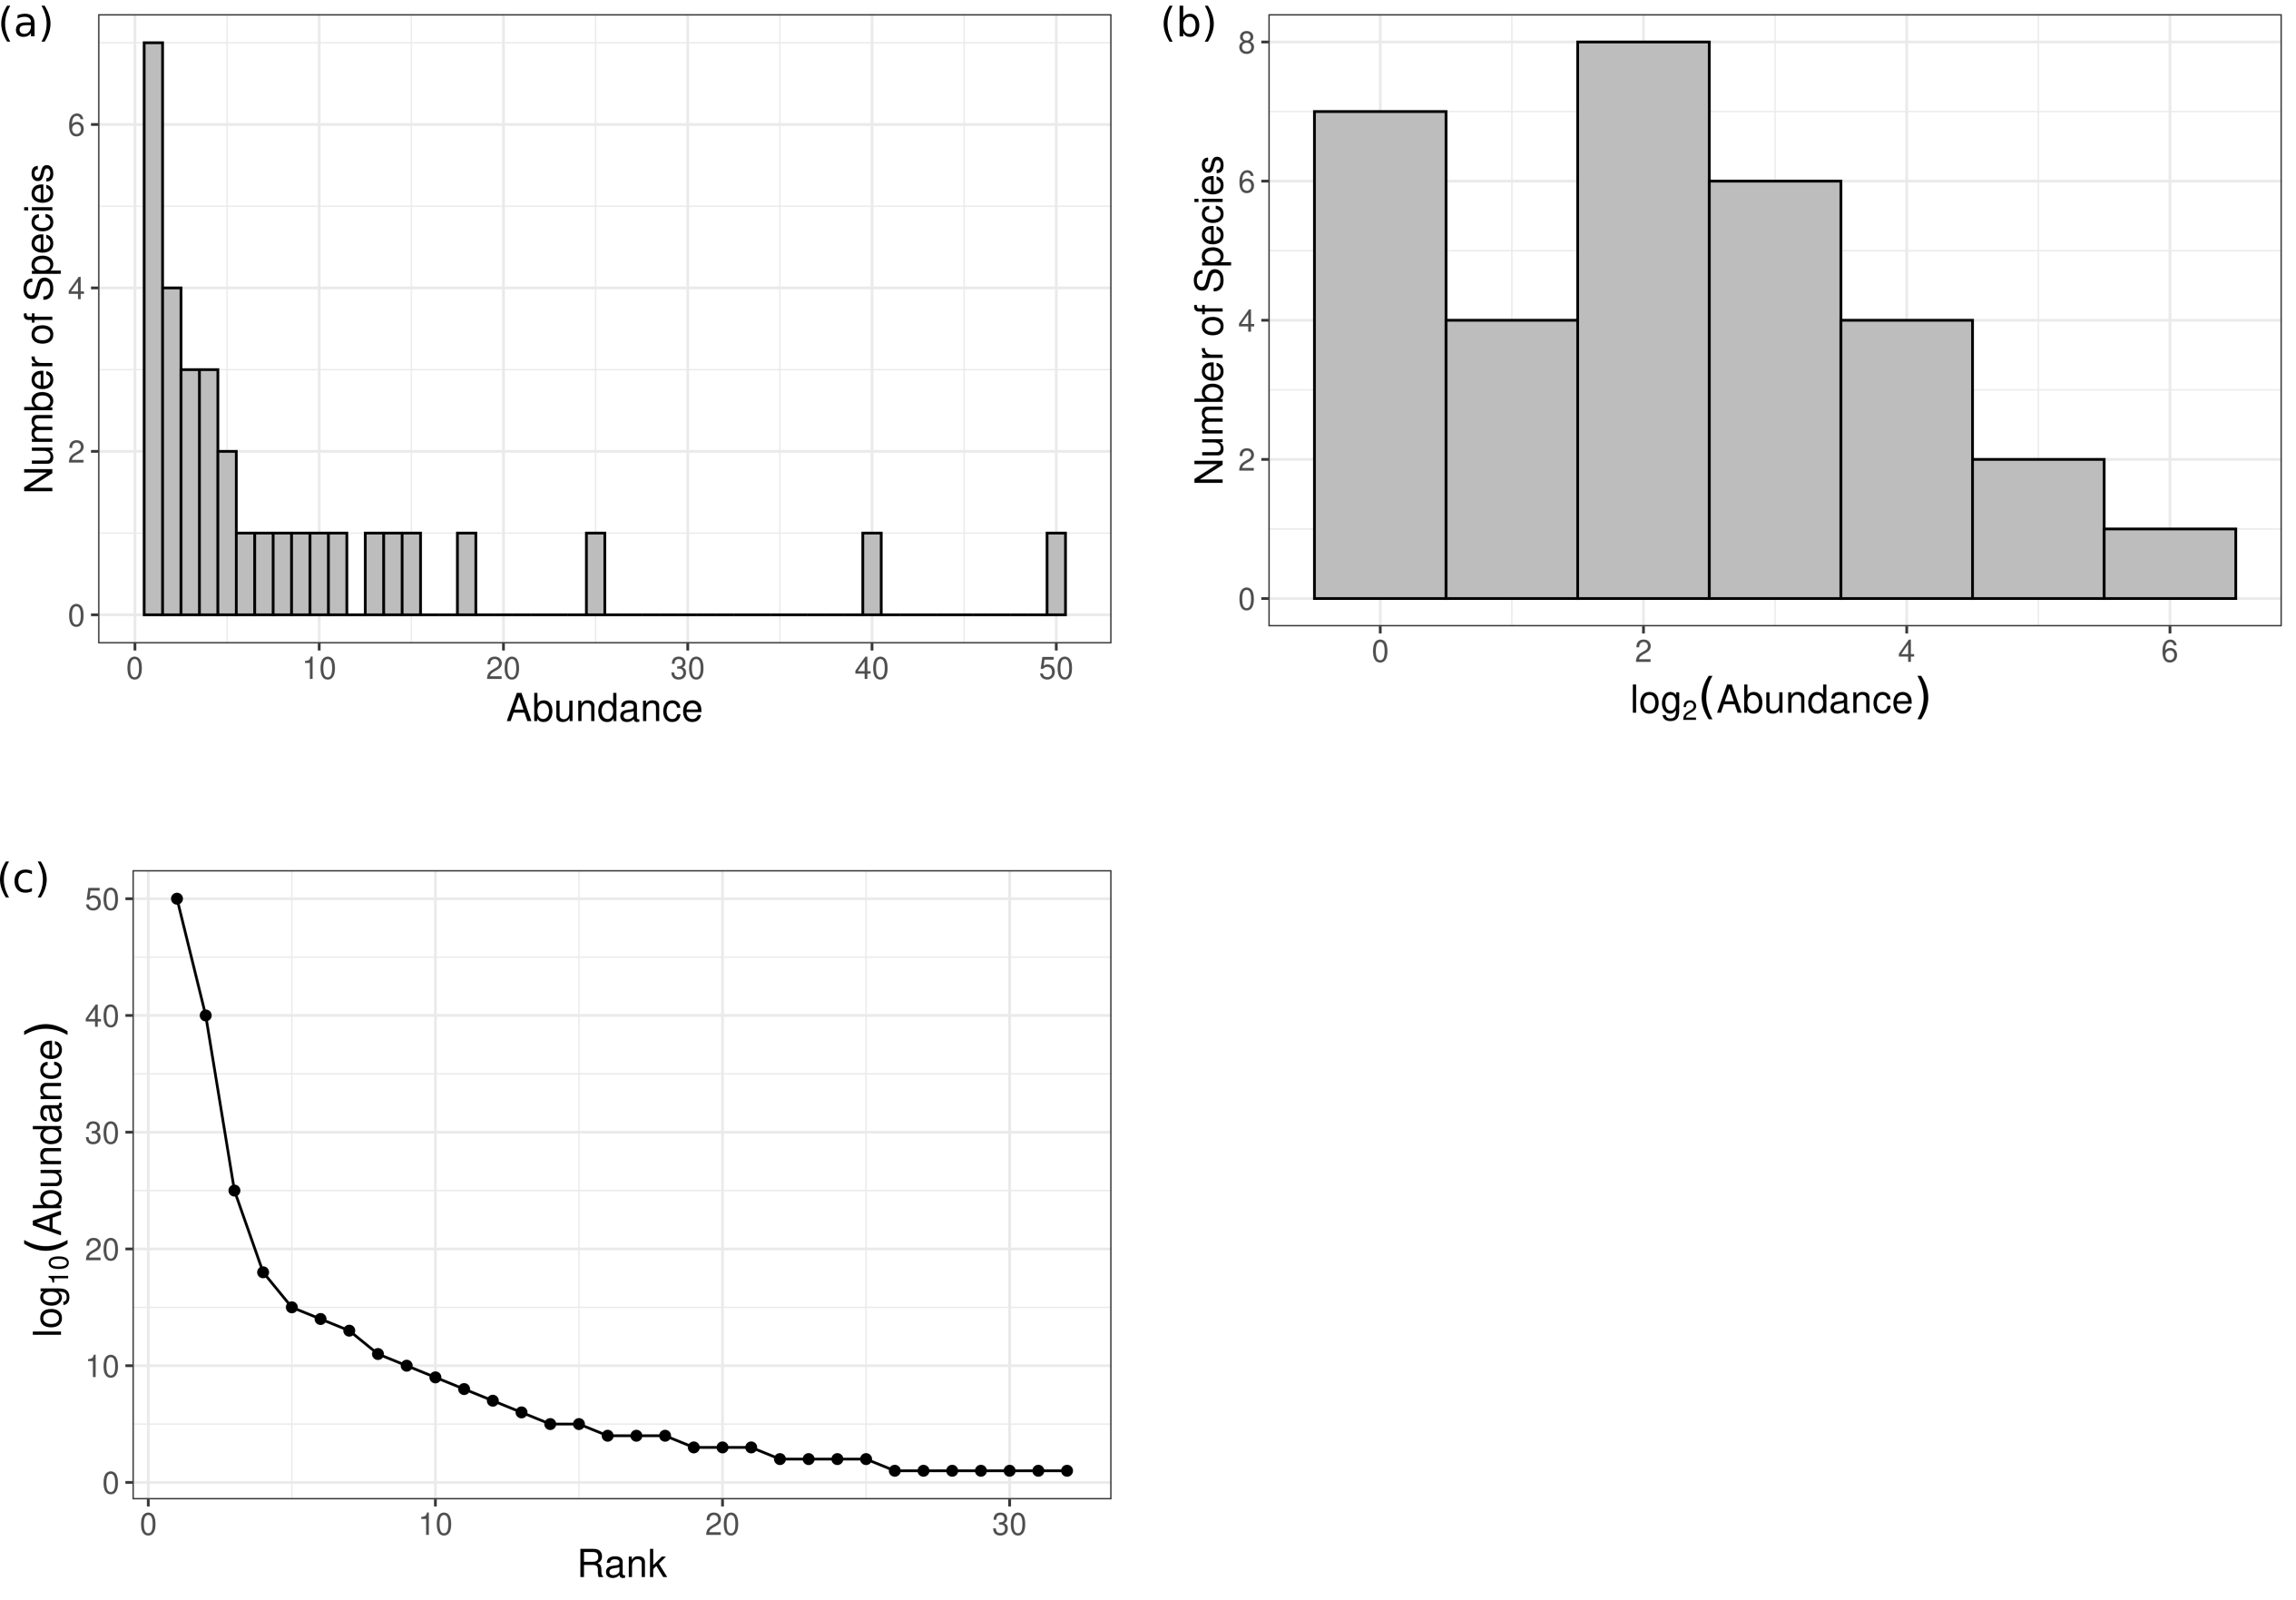
Fig. 69 Common methods for plotting SADs. a) Plotting the histogram of species abundances on a linear scale produces a characteristic hyperbolic curve. b) Plotting a histogram of log transformed species abundances binned into double classes can yield a normal-like distribution. c) The rank abundance distribution is the most common way to plot species abundances.#
Because of the universal pattern of the hyperbolic progression on an arithmetic scale, a major thrust of research has been to understand the processes that generate this pattern. However, SADS have also been used for practical purposes in conservation and biodiversity studies such as identification of rare species, detecting influence of disturbance, and quantifying change in the composition of communities through space and time.
McGill et al. [2007] identify four major approaches to the study of SADs:
Visual: Early studies involved the qualitative visual comparison of SADs or RADs, typically with a focus on comparing the species richness and evenness of communities.
Parametric approach: Under this approach the species abundance distribution (SAD) is described by the parameters of a statistical distribution. The distribution can be chosen on empirical grounds simply because it provides a good description of the data (statistical approach) or be derived from first principles based on mechanistic assumptions about the factors which structure biological communities (mechanistic approach). Uses of this approach range from testing theories about community assembly to the comparison of communities across time, space, and other gradients.
Non-parametric approach: This approach includes common univariate biodiversity measures such as species richness, evenness, and diversity. Such measures are not based on a parametric statistical distribution, but rather measure different aspects of a given species abundance distribution.
Multivariate: This approach is usually used when comparing two or more communities and considers the full multivariate nature of the data. The most common approach is to calculate some measure of (dis)similarity between communities after which ordination, clustering, and other methods are used to visualize and quantify changes in community composition. Notably, this method preserves species identity and therefore gives the most detailed understanding of changes in community composition.
References#
- MEG+07(1,2)
Brian J McGill, Rampal S Etienne, John S Gray, David Alonso, Marti J Anderson, Habtamu Kassa Benecha, Maria Dornelas, Brian J Enquist, Jessica L Green, Fangliang He, and others. Species abundance distributions: moving beyond single prediction theories to integration within an ecological framework. Ecology letters, 10(10):995–1015, 2007.