Fluctuations and Uncertainty of Wind and Solar Power Generation#
Part of a series: Uncertainty in Future Energy Systems.
Follow reading here
Introduction#
Future energy systems will rely on renewable power sources, especially wind and solar power. Their operation depends on the weather and is thus highly variable and uncertain. In this article, we will discuss fluctuations in renewable power generation occurring on different time scales.
Fluctuations on Different Time Scales#
First, there are deterministic periodic variations. Obviously, there is a strong diurnal variation in solar power generation, which is simply zero during the night. Notably, wind power generation may also show a weak deterministic diurnal variation [Emeis, 2014]. The seasonal variability is also apparent for solar power. Solar power generation is higher in summer, as days are longer and the solar zenith angle is smaller. Wind power typically shows a pronounced seasonal variation, too, depending on the location. In Europe, wind power generation is higher in the winter such that the seasonal variations of wind and solar power generation balance [Heide et al., 2010].
Stochastic fluctuations of wind and solar power on time scales up to one hour were reviewed in [Anvari et al., 2016]. One finds that generation is highly intermittent. That is, the power output can change substantially from low to maximal values and back in a short period of time. This behavior can be quantified in terms of the increments
where \(P(t)\) is the power generation at time \(t\). Fig. 47 shows the increment statistics for different values of \(\tau\) for wind and solar power reproduced from [Anvari et al., 2016]. It is obvious that the statistics is far from Gaussian and exhibits heavy-tails, such that large values of \(X_\tau\) occur far more often than expected from ordinary normal statistics.
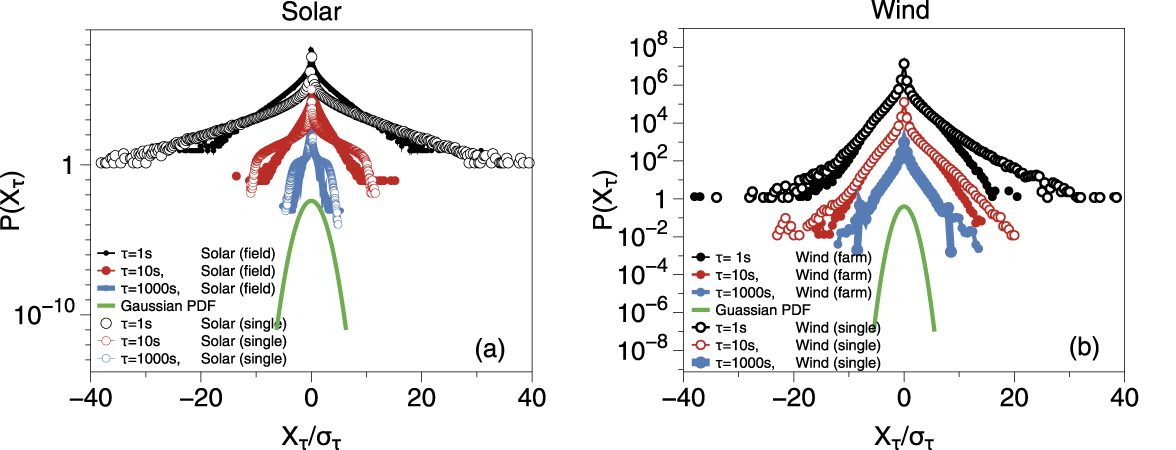
Fig. 47 Empirical probability density functions of the increments of power power generation \(X_\tau(t) = P(t+\tau) - P(t)\) for solar photovoltaics (left panel) and wind power (right panel). Increments are given in the unit of the respective standard deviation \({\sigma }_{\tau }\) and PDFs are shifted in the vertical direction to improve visibility. Figure is a cropped version taken from [Anvari et al., 2016], which is licensed under the CC BY 3.0 DEED license.#
Fluctuations of wind power generation on short time scales are driven by turbulence [Milan et al., 2013] and thus share many statistical properties with other turbulent processes. In particular, the power spectrum \(S(f)\) follows the characteristic Kolmogorov law of turbulence [Kolmogorov, 1968],
up to a frequency of \(f \approx 0.1 {\rm Hz}\). At higher frequencies, the internal dynamics and inertia of the wind turbine must be taken into account such that the power generation \(P(t)\) does not simply follow the momentary wind speed \(v(t)\) [Milan et al., 2013].
The intermittency of solar power generation on short time scales is driven by cloud dynamics [Tabar et al., 2014]. On a partly cloudy day, the generation of a single photovoltaic panel will rapidly jump from a high to a low value if a cloud moves over the panel. To model this flickering behavior, [Anvari et al., 2016] suggest a stochastic process with a bistable potential.
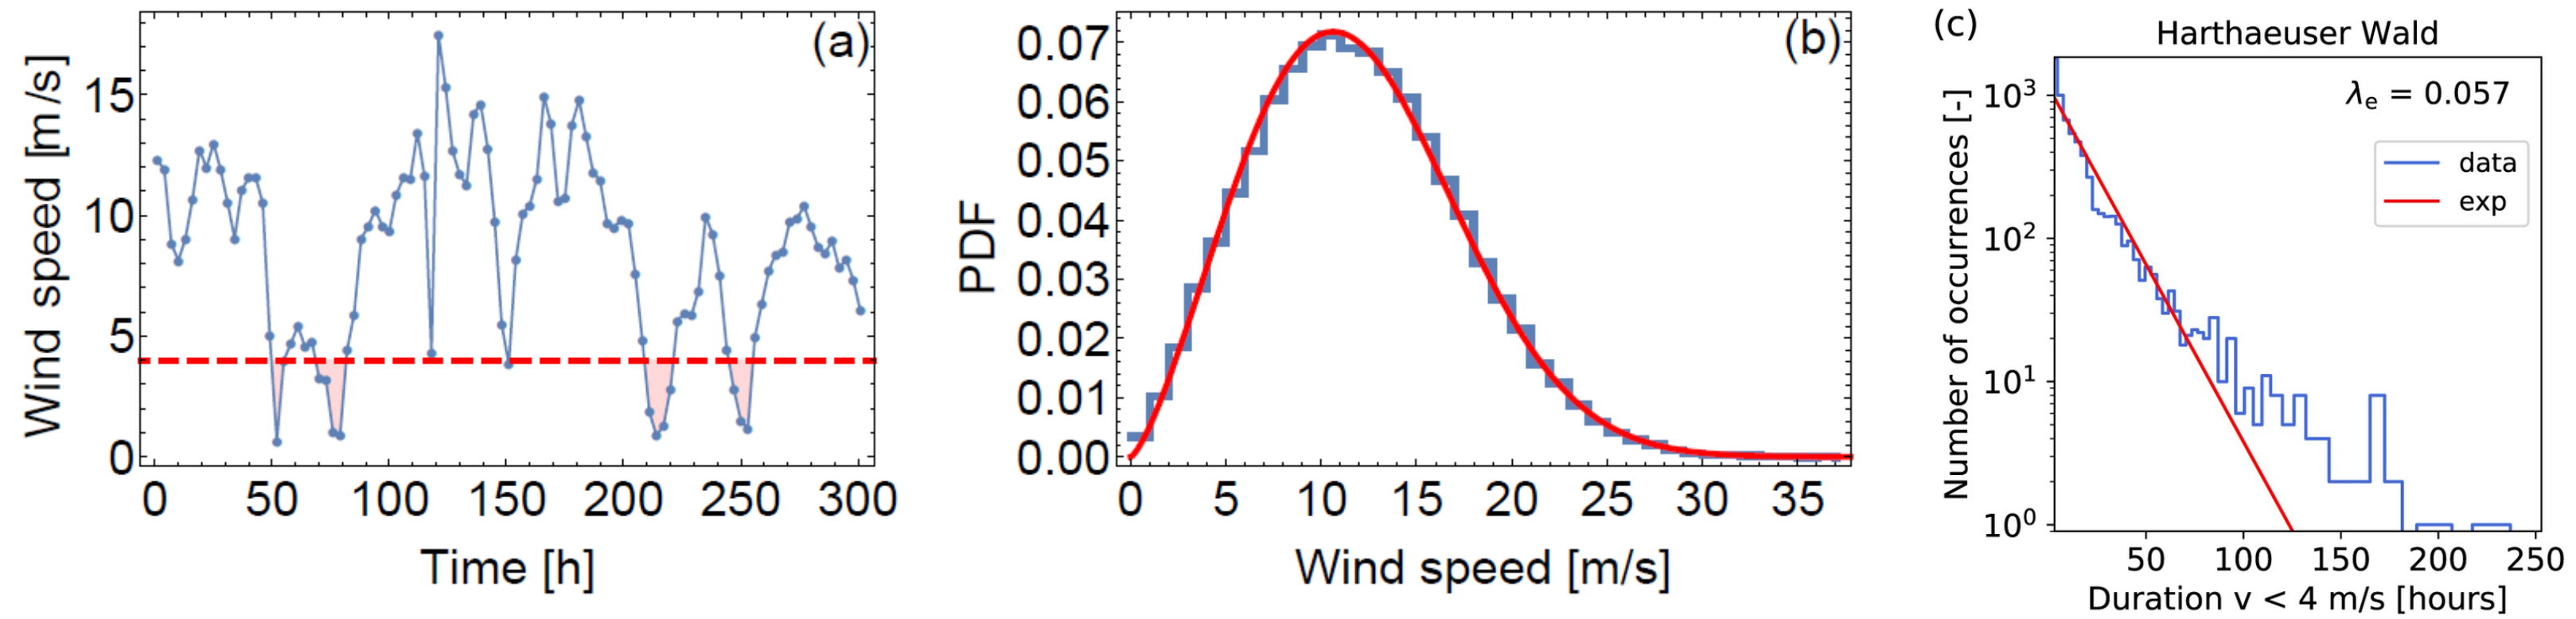
Fig. 48 (a) Time series of the wind speed (i.e., wind speed \(v(t)\)) at the location of the Alpha Ventus wind farm in the North Sea from the ERA-Interim reanalysis [Dee et al., 2011]. (b) The distribution of the wind speed \(v(t)\) is well described by a Weibull distribution. The figure shows a histogram of the data (blue) and the most likely Weibull distribution (red) with shape parameter \(\alpha \approx 2.36\) and scale parameter \( \beta \approx 9.66\). (c) Histogram (blue) of the duration \(d\) of periods with low wind power generation (velocity \(v < 4 m/s\)) at the location Harthaeuser Wald in Germany. The red line shows the most likely exponential distribution given by the exponential constant \(\lambda_e\), which strongly underestimates the tails of the distribution for long durations. Figure reproduced from [Weber et al., 2019], which is licensed under the CC BY 4.0 DEED license.#
The variability of wind and solar power on time scales of hours to weeks is intensively studied in research and engineering (see, e.g., [Staffell and Pfenninger, 2018]). This variability is related to the atmospheric dynamics on the synoptic scale, which is of the order of magnitude of \(1000\) km. Typically, high- and low-pressure systems seen on weather maps are on the synoptic scale. Numerical weather forecasts are essential to predict the variability of renewable power generation on the synoptic time scale [Ahmed et al., 2020, Emeis, 2018]. A particular challenge in this area is the prediction of ramp events (i.e., events where the generation changes quickly) and their timing [Gallego-Castillo et al., 2015]. Energy system simulation and optimization models typically use historical weather data, more precisely reanalysis datasets [Dee et al., 2011, Staffell and Pfenninger, 2016] or synthetic time series from generative models [Cramer et al., 2022].
The statistics of the wind speed \(v(t)\) on this time scale is well described by a Weibull distribution as shown in Fig. 48. Wind speeds can then be converted to wind power generation via the power curve of the respective wind turbine which is typically given by
where \(v_i\), \(v_r\) and \(v_o\) are the cut-in, rated and cut-out velocities of the turbine, respectively. \(P_{\rm rated}\) refers to the rated power of the wind turbine.
In addition to the overall statistics, temporal and spatial correlations are important for power system operation. For instance, long periods of low renewable generation constitute a major challenge and typically require fossil backup power plants. The persistence of periods with constantly low or high wind power generation in Europe has been studied in [Weber et al., 2019]. Assuming that the events that cross a threshold follow a Poisson process, the resulting persistence statistics should follow an exponential distribution. It was shown that the duration of such periods is not well described by an exponential distribution but rather features heavy tails as shown in Fig. 48. Remarkably, long periods can be observed for very different weather regimes. For example, extremely long low wind periods were observed for a strong Azores High and extended ridge towards Central Europe, a blocking condition, and a cold high pressure centre over Eastern Europe.
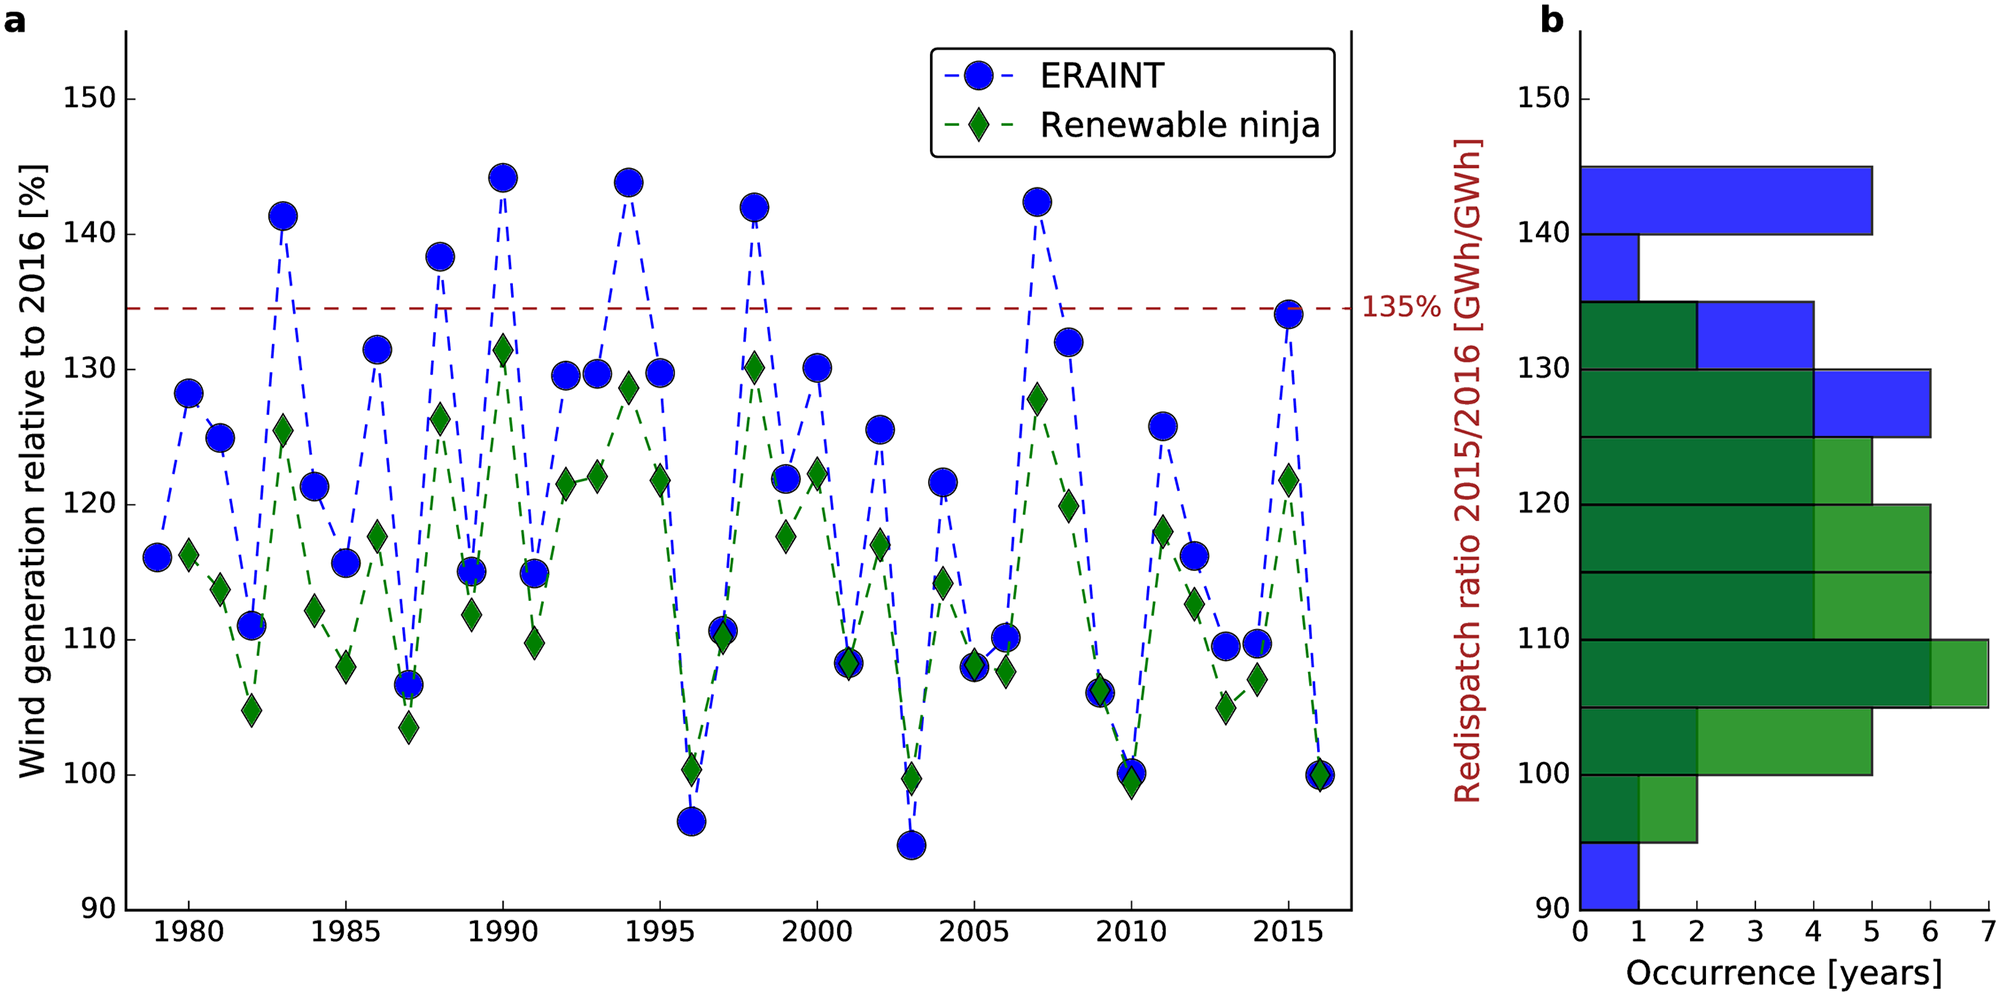
Fig. 49 Natural variability of wind generation in Germany relative to 2016. (a) Time series of wind generation and (b) its empirical distribution for a fictitious fixed wind turbine fleet that is kept constant to focus on the impact of wind variability on wind power generation. Blue denotes calculations [Wohland et al., 2018] and green indicates results from the renewables.ninja dataset [Staffell and Pfenninger, 2016]. The dashed brown line indicates the ratio of 2015 to 2016 of the redispatch volume (i.e., the amount of a change in power output at different power plants that is requested by grid operators to prevent congestion) in the German power transmission grid. Figure reproduced from [Wohland et al., 2018], which is licensed under the CC BY 4.0 DEED license.#
Renewable power generation displays considerable inter-annual variability. Fig. 49 shows how annual wind power generation in Germany would vary if the wind turbine fleet would be fixed. One observes that variations of \(\pm 20 \%\) from one year to another occur regularly. The inter-annual variability has considerable impacts on energy system operation and must be taken into account in any energy system simulation or optimization model [Collins et al., 2018]. Renewable power generation is further affected by climatic variations on even longer time scales [Wohland et al., 2019]. For instance, wind power resources in Western Europe are affected by the North Atlantic Oscillation (NAO).
References#
- ASMA20
Razin Ahmed, V Sreeram, Y Mishra, and MD Arif. A review and evaluation of the state-of-the-art in pv solar power forecasting: techniques and optimization. Renewable and Sustainable Energy Reviews, 124:109792, 2020.
- ALWachter+16(1,2,3,4)
Mehrnaz Anvari, Gerald Lohmann, Matthias Wächter, Patrick Milan, Elke Lorenz, Detlev Heinemann, M Reza Rahimi Tabar, and Joachim Peinke. Short term fluctuations of wind and solar power systems. New Journal of Physics, 18(6):063027, 2016.
- CDGallachoir+18
Seán Collins, Paul Deane, Brian Ó Gallachóir, Stefan Pfenninger, and Iain Staffell. Impacts of inter-annual wind and solar variations on the european power system. Joule, 2(10):2076–2090, 2018.
- CGM+22
Eike Cramer, Leonardo Rydin Gorjao, Alexander Mitsos, Benjamin Schafer, Dirk Witthaut, and Manuel Dahmen. Validation Methods for Energy Time Series Scenarios From Deep Generative Models. IEEE Access, 10:8194–8207, 2022. doi:10.1109/ACCESS.2022.3141875.
- DUS+11(1,2)
Dick P Dee, S Mꎬ Uppala, Adrian J Simmons, Paul Berrisford, Paul Poli, Shinya Kobayashi, U Andrae, MA Balmaseda, G Balsamo, d P Bauer, and others. The era-interim reanalysis: configuration and performance of the data assimilation system. Quarterly Journal of the royal meteorological society, 137(656):553–597, 2011.
- Eme14
Stefan Emeis. Current issues in wind energy meteorology. Meteorological Applications, 21(4):803–819, 2014.
- Eme18
Stefan Emeis. Wind energy meteorology: atmospheric physics for wind power generation. Springer, 2018.
- GCCTLG15
Cristobal Gallego-Castillo, Alvaro Cuerva-Tejero, and Oscar Lopez-Garcia. A review on the recent history of wind power ramp forecasting. Renewable and Sustainable Energy Reviews, 52:1148–1157, 2015.
- HVBG+10
Dominik Heide, Lueder Von Bremen, Martin Greiner, Clemens Hoffmann, Markus Speckmann, and Stefan Bofinger. Seasonal optimal mix of wind and solar power in a future, highly renewable europe. Renewable Energy, 35(11):2483–2489, 2010.
- Kol68
AN Kolmogorov. Local structure of turbulence in an incompressible viscous fluid at very high reynolds numbers. Soviet Physics Uspekhi, 10(6):734, 1968.
- MWachterP13(1,2)
Patrick Milan, Matthias Wächter, and Joachim Peinke. Turbulent character of wind energy. Physical review letters, 110(13):138701, 2013.
- SP16(1,2)
Iain Staffell and Stefan Pfenninger. Using bias-corrected reanalysis to simulate current and future wind power output. Energy, 114:1224–1239, 2016.
- SP18
Iain Staffell and Stefan Pfenninger. The increasing impact of weather on electricity supply and demand. Energy, 145:65–78, 2018.
- TAL+14
M Reza Rahimi Tabar, M Anvari, G Lohmann, D Heinemann, M Wächter, P Milan, E Lorenz, and Joachim Peinke. Kolmogorov spectrum of renewable wind and solar power fluctuations. The European Physical Journal Special Topics, 223:2637–2644, 2014.
- WRB+19(1,2)
Juliane Weber, Mark Reyers, Christian Beck, Marc Timme, Joaquim G Pinto, Dirk Witthaut, and Benjamin Schäfer. Wind power persistence characterized by superstatistics. Scientific reports, 9(1):1–15, 2019.
- WOKW19
Jan Wohland, Nour Eddine Omrani, Noel Keenlyside, and Dirk Witthaut. Significant multidecadal variability in german wind energy generation. Wind Energy Science, 4(3):515–526, 2019.
- WRMarkerW18(1,2)
Jan Wohland, Mark Reyers, Carolin Märker, and Dirk Witthaut. Natural wind variability triggered drop in german redispatch volume and costs from 2015 to 2016. PloS one, 13(1):e0190707, 2018.
Contributors#
Jonas Bauer, Annette Möller, and Lars Nerger