Analyzing Compositional Dissimilarity Using Diffusion Maps (Draft)#
In The Multivariate Approach, we noted that complex, high-dimensional compositional data can introduce bias and error when calculating compositional dissimilarity between species assemblages. We address this issue here and present diffusion maps, a manifold learning method, as a way to robustly compare species assemblages.
Global Distances Introduce Error#
Consider a simple example where three species exhibit a uni-modal response to a single environmental gradient (Fig. 72a). Sampling species assemblages along the gradient and plotting the resulting relative abundances yields a three-dimensional curve, termed a manifold (Fig. 72b). The environmental gradient constrains the abundance of each species such that we do not observe all possible combinations of species abundances. Rather, the compositional data clusters around a lower-dimensional manifold relative to the dataspace. Because this manifold represents the community compositions that can actually be realized, a natural measure of distance between communities is the distance between them along the manifold. However, calculating the pairwise distance directly between two points does not necessarily approximate the distance between them along the manifold. For example, the distance calculated directly between communities at opposite ends of the gradient greatly underestimates the distance between them along the manifold. The pairwise distance calculated between communities at opposite ends of the environmental gradient (Fig. 72b: red arrow) indicates that they are very similar, when in fact they can only occur at opposite environmental extremes, representing the traversal of the entire manifold (purple arrow).
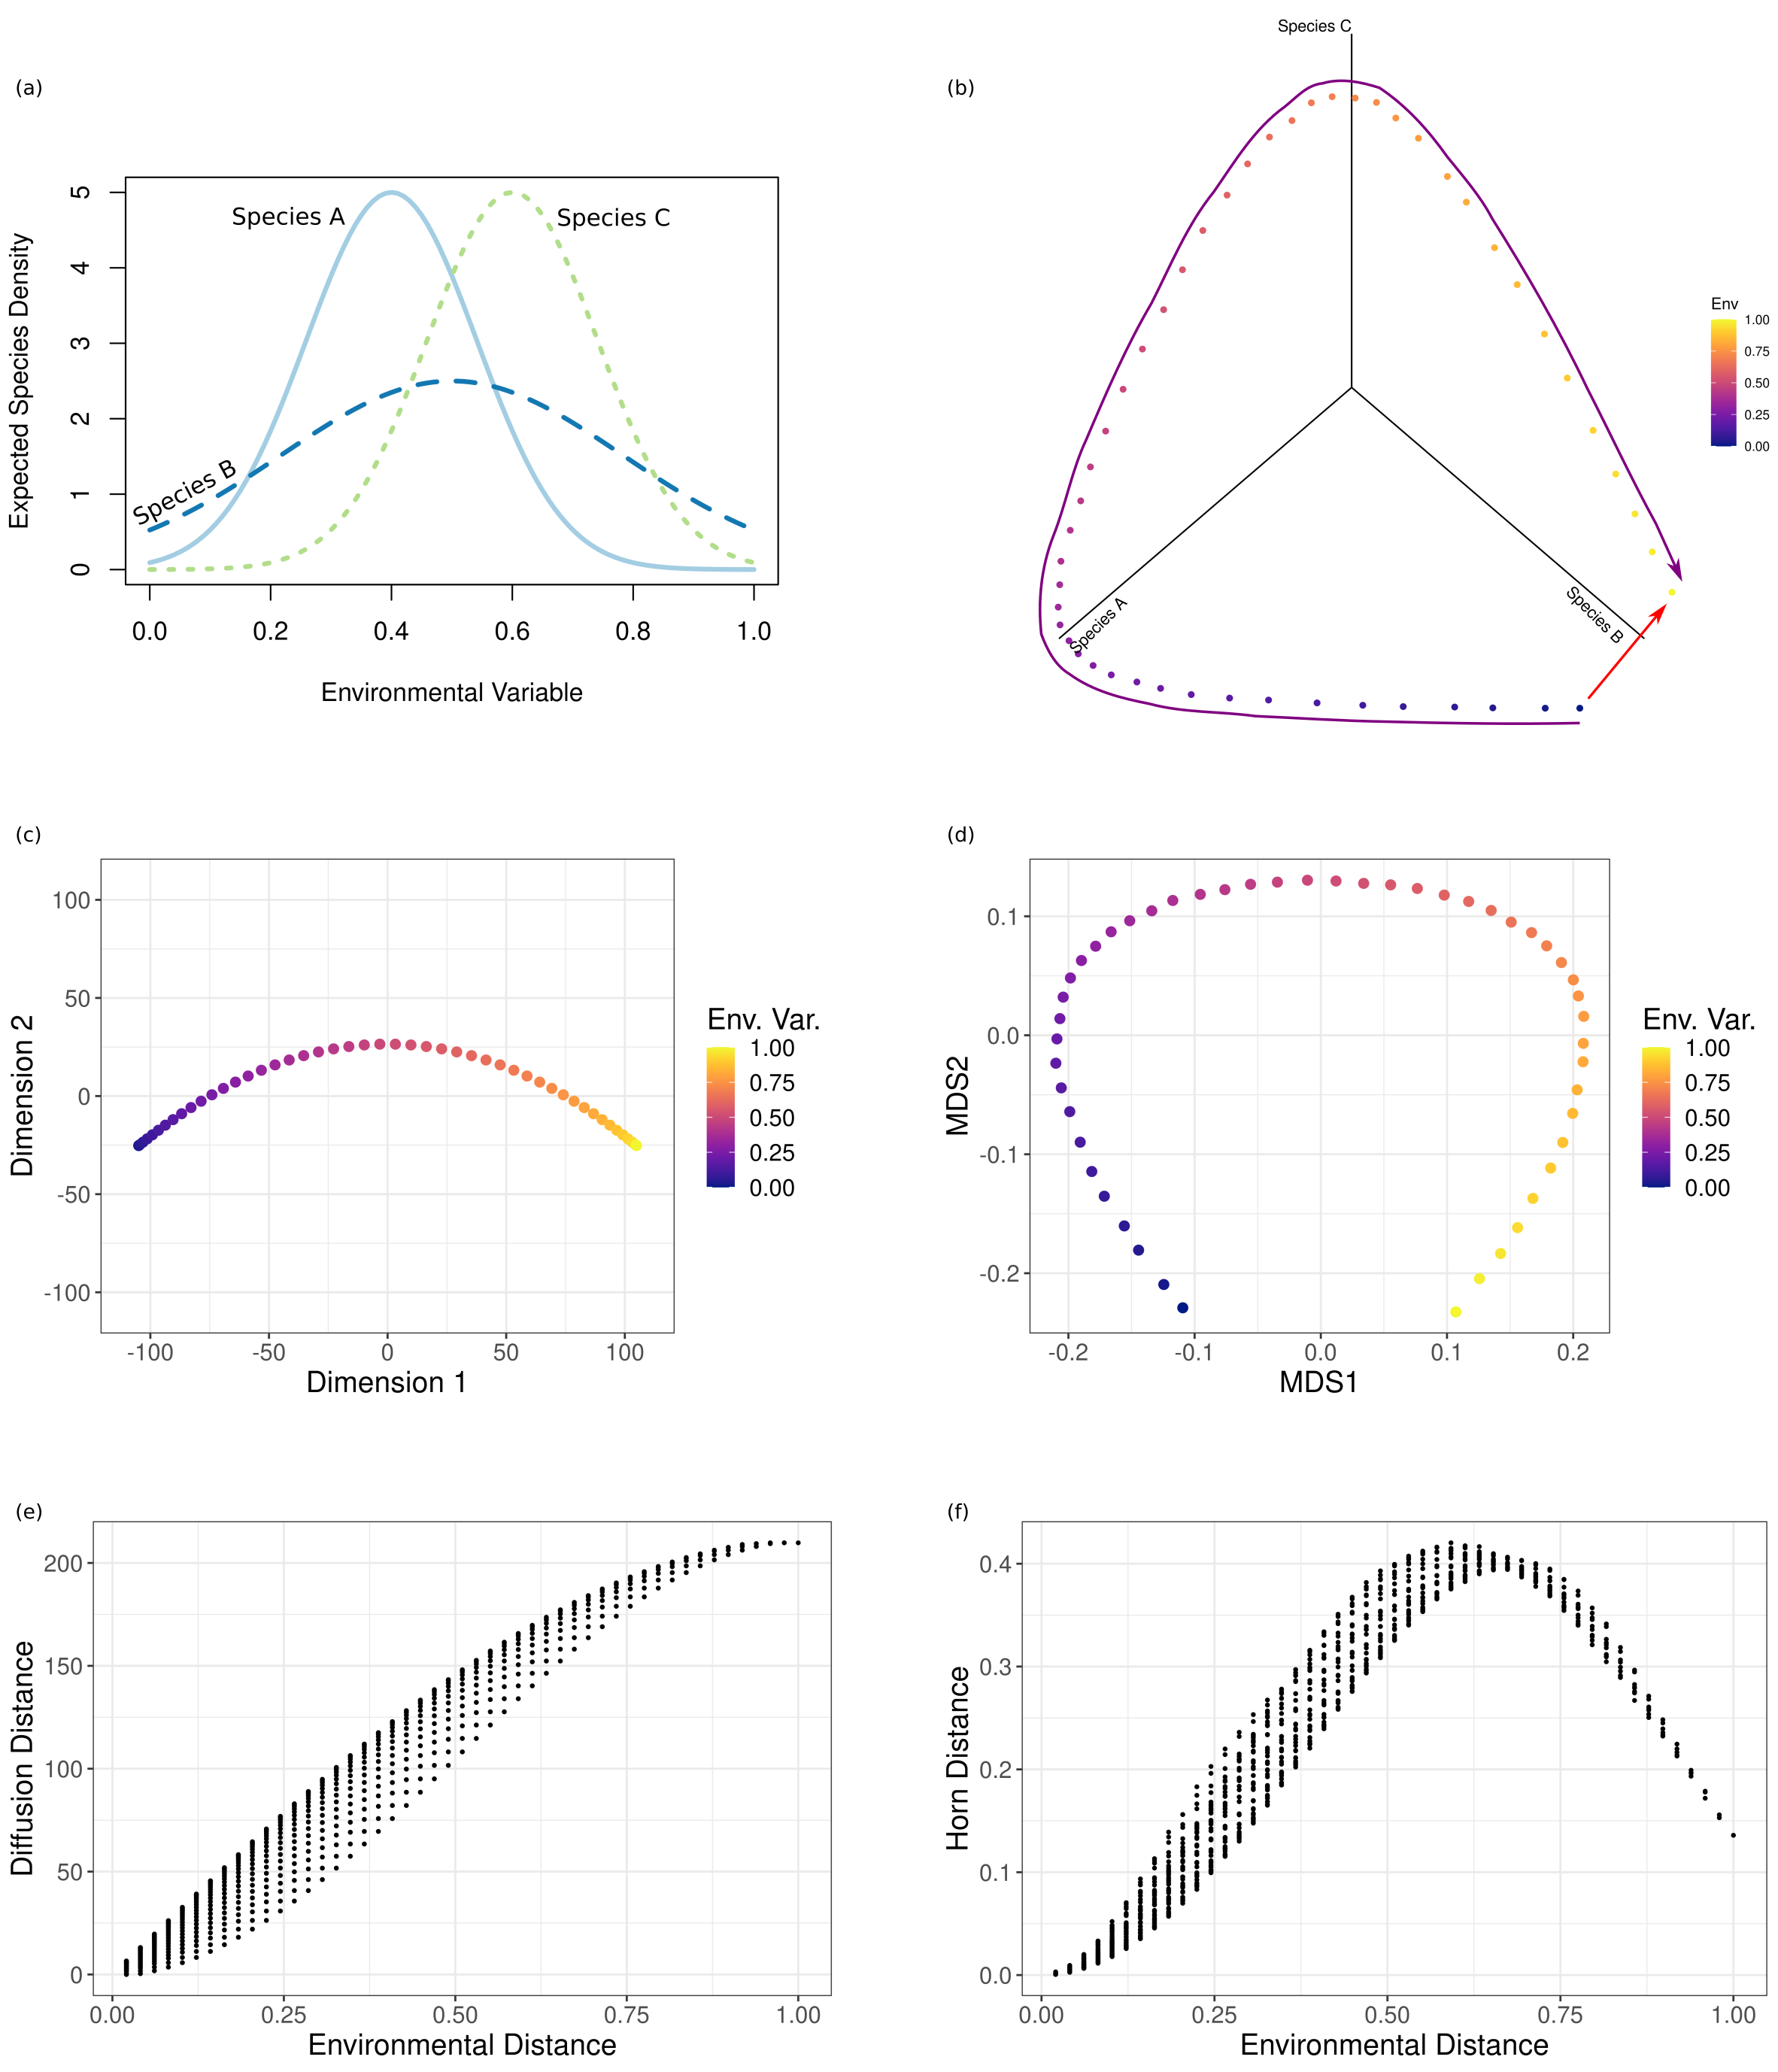
Fig. 72 Non-metric multidimensional scaling and diffusion maps applied to artificial species assemblages. (a) Response curves for three species to a single environmental gradient. Each curve defines the expected number of individuals sampled at a given value of the environmental gradient. (b) Plot of the relative abundance of the three species at 50 locations along the environmental gradient. Abundances were obtained as Poisson variates with expectation values defined by the response curves. Points are shaded by their location along the environmental gradient. (c) Diffusion map and (d) two-dimensional NMDS configuration of the data plotted in (b). The diffusion map “unrolls” the manifold in a single dimension, correctly ordering sites along the environmental gradient. In contrast, NMDS misorders sites along the environmental gradient. (e) Plotting the diffusion distance against the environnmental distance correctly indicates that compositional dissimilarities increases monotonically along the environmental gradient. (f) Plotting the global distances against environmental distance erroneously indicates that compositional dissimilarity increases and then decreases along the environmental gradient.#
Performing the analysis presented in The Multivariate Approach demonstrates how long-range comparisons between communities at opposite ends of the environmental gradient can introduce error in dimensionality reduction. Using non-metric multidimensional scaling (NMDS) to represent the data plotted in Fig. 72b in two dimensions, we see that sites are now misordered along MDS1 relative to the environmental gradient (FFig. 72d). This issue arises because NMDS seeks to preserve the rank-order of the entire distance matrix. The pair-wise distance between communities at opposite ends of the gradient indicates that they are similar which forces NMDS to place samples at the opposite end of the gradient close to one another. Similarly, plotting the compositional distance against environmental distance (Fig. 72f) erroneously indicates that compositional dissimilarity increases and then decreases along the environmental gradient.
Diffusion Maps Use Only Local Distances#
Diffusion maps are a manifold learning method that find complex manifolds in high-dimensional data [Coifman et al., 2005]. In doing so, diffusion maps provide a lower-dimensional embedding for the data in which the Euclidean distance between data points approximates the distance between them along the manifold. Crucially, diffusion maps rely only on comparisons between objects that are sufficiently similar, avoiding the issues associated with comparing very dissimilar objects.
We apply diffusion mapping to the data plotted in Fig. 72b to demonstrate how considering only local distances can be used to explore the global structure of the multivariate data. See the Diffusion Maps article for a detailed description of the method. Here we used the Horn similarity as our measure of pairwise similarity between all sites (the Horn similarity is the one-complement of the Horn distance introduced in The Multivariate Approach). We thresholded the similarity matrix, keeping only the two nearest-neighbors for each site. By considering only sites that are sufficiently similar, the diffusion map is able to spread the manifold out over a single dimension, successfully recovering the order of the sites along the one-dimensional environmental gradient (Fig. 72c). The coordinate of each site along the first dimension of the diffusion map now serves as a one-dimensional representation of the species composition at each site.
Additionally, within the diffusion map, the Euclidean distance between sites approximates the “diffusion distance” between them along the manifold. Plotting the pairwise diffusion distances against environmental distance correctly indicates that compositional change accumulates monotonically along the environmental gradient (Fig. 72e).
References#
- CLL+05
Ronald R Coifman, Stephane Lafon, Ann B Lee, Mauro Maggioni, Boaz Nadler, Frederick Warner, and Steven W Zucker. Geometric diffusions as a tool for harmonic analysis and structure definition of data: diffusion maps. Proceedings of the national academy of sciences, 102(21):7426–7431, 2005.