Species Abundance Distribution: Parametric Approaches#
Under the parametric approach, the species abundance distribution (SAD) for a given biological community is described by the parameters of a statistical distribution. The distribution can be chosen on empirical grounds so that it it provides a good description of the data without explicitly considering the mechanisms that structure the community (statistical approach) [McGill et al., 2007]. Alternatively, the distribution can be derived from first principles based on mechanistic assumptions about the factors which structure biological communities (mechanistic approach) [McGill et al., 2007]. The line between the two is not always clear-cut because some distributions initially chosen on empirical grounds can be derived from mechanistic models. Below is a brief overview of some statistical distributions commonly used to describe species abundance distributions.
Statistical Approach#
The statistical approach views SADs as samples from an underlying distribution. Different assumptions about the underlying distribution and the sampling process yield different SADs. Gamma and log-normal distributions are commonly used as underlying distributions and sampling processes are often assumed to be either Poisson, negative binomial, or binomial [McGill et al., 2007]. Two historically important SADs are Fisher’s log-series and Preston’s log-normal [Fisher et al., 1943, Preston, 1948]. In the 1940s, Fisher et al. [1943] derived the log-series distribution to describe empirical SADs. Preston [1948], on the other hand, argued that the log-normal provided a better fit to empirical data. Both distributions have been fit to a wide variety of data-sets and are still commonly used today. They are described in more detail below. Many statistical models have been proposed since (reviewed in [McGill et al., 2007]).
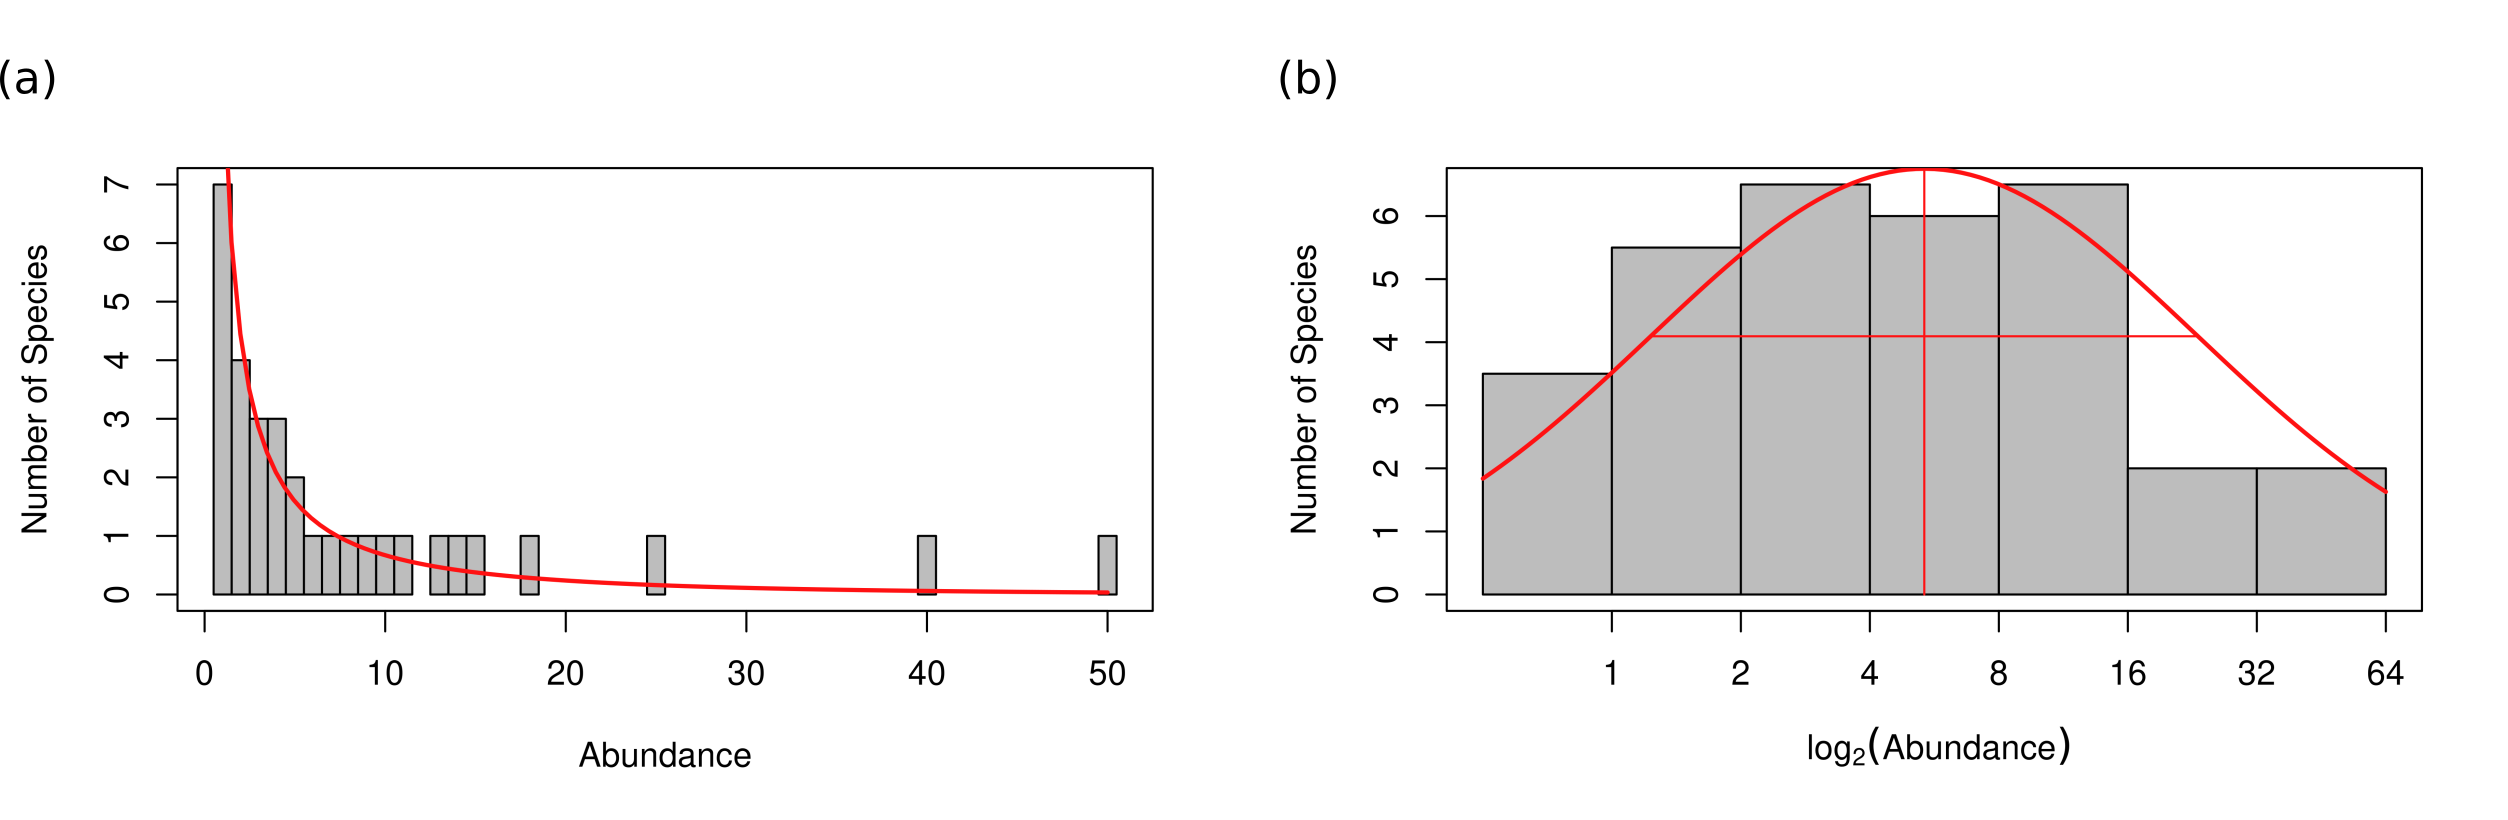
Fig. 70 Species abundance distribution a) on an arithmetic scale fit to Fisher’s log-series model and b) fit to Preston’s log-normal model after being log-transformed (base 2) and binned into doubling classes.#
Fisher’s Log-Series#
Fisher et al. [1943] derived the log-series to fit species abundance distributions of butterflies collected by Steven Corbet in the Malay Archipelago and moths collected by Carrington Williams at Rothamsted Experimental Station [Hubbell, 2001]. The following provides a summary of an excellent overview in Hubbell [2001]. Fisher assumed that the true relative abundances of the species were gamma distributed. Because most species were rare, he also assumed that they would be sampled according to a Poisson process. This compound distribution is negative binomial, which Fisher truncated to eliminate the zero class because species that are too rare to be sampled are not observable. Finally, because there was no way to estimate how many species were not sampled (and thus the total number of species in the community), Fisher assumed an infinite number of species in the community. This yields a single-parameter distribution that Fisher named the logarithmic series (Fig. 70a).
Log-Normal Distribution#
Preston [1948] noticed that when species were binned into doubling classes (essentially transforming the data by log base 2), the resulting histogram of species abundances looked like a normal distribution with a single mode at intermediate levels of abundance [Hubbell, 2001]. The following is a short summary from an overview in Hubbell [2001]. Preston argued that the continuous log-normal is a good approximation to empirical SADs (Fig. 70b). Additionally, Preston showed that small samples from the log-normal distribution yield SADs that conform well to Fisher’s log-series but that as sampling intensity increased, the SADs become more log-normal. He thus argued that log-series distributed data is due to poor sampling and that the log-normal distribution will be revealed as communities are more thoroughly sampled.
Mechanistic Approach#
Rather than seeking a distribution that provides a good description of the data, other researchers sought to build models from first principles that predict realistic SADs [McGill et al., 2007]. Early attempts sought an explanation in the sequential apportionment of resources amongst an arbitrary number of species [McGill et al., 2007]. The assumption here is that species compete for a given resource and that securing more of this resource corresponds to a higher numerical abundance. These models apportion a single, limited environmental resource amongst species and various apportionment rules yield different predictions about the shape of the resulting SAD. Motomura [1932] formulated the first such model, sometimes called the “niche preemption” model. Under Motomura’s model, a single environmental resource is successively divided by a constant fraction. This yields a geometric distribution and predicts very uneven abundances. MacArthur [1957] and MacArthur [1960] proposed a similar model (termed the “broken stick” model) but with the environmental resource being partitioned simultanesouly at random values which predicts very even abundances. Finally, Sugihara [1980] proposed a modifcation where a single resource is apportioned randomly and sequentially which produces a log-normal distribution of abundances.
Later mechanistic models were formulated based on a number of different processes (reviewed in [McGill et al., 2007]).
Uses of SADs#
Because different mechanistic models make different predictions about various features of SADs, one common use of SADs has been to fit statistical distributions to empirical SADs as a means to select between different theories of community assembly. However, it has proven difficult, if not impossible, to distinguish between different SADs based on empirical data [McGill et al., 2007]. SADs have also commonly been used to compare communities over spatial, temporal, or environmental gradients. Both a strength and a weakness of SADs is that they do not preserve information about species identity. This is a weakness in that shifts in species dominance are not recorded in SADs. But it is also a strength because SADs can be used to compare features of assemblages that share no species in common. For example, initial research into patterns along productivity gradients suggests that high productivity systems are well fit by log-normal curves while low productivity systems have low evenness and are well fit by geometric curves [Whittaker, 1975, Whittaker, 1965]. Examination of the SAD for a single community undergoing succession has revealed that the SAD becomes more log-normal and even over time [Bazzaz, 1975]. Finally, SADs have also been used to detect the impact of human disturbance such as pollution. For example, Gray [1979] found that various kinds of pollution lead to a decrease in rare species and an increase in species of intermediate-abundance (a shift from log-series to log-normal) in a marine ecosystem. In these examples, treating statistical distributions as a simple description of the data can still yield insight into aspects of community composition.
References#
- Baz75
FA Bazzaz. Plant species diversity in old-field successional ecosystems in southern illinois. Ecology, 56(2):485–488, 1975.
- FCW43(1,2,3)
Ronald A Fisher, A Steven Corbet, and Carrington B Williams. The relation between the number of species and the number of individuals in a random sample of an animal population. The Journal of Animal Ecology, pages 42–58, 1943.
- Gra79
JS Gray. Pollution-induced changes in populations. Philosophical Transactions of the Royal Society of London. B, Biological Sciences, 286(1015):545–561, 1979.
- Hub01(1,2,3,4)
Stephen P. Hubbell. The Unified Neutral Theory of Biodiversity and Biogeography (MPB-32). Princeton University Press, Princeton, 2001. ISBN 9781400837526. URL: https://doi.org/10.1515/9781400837526, doi:doi:10.1515/9781400837526.
- Mac60
Robert MacArthur. On the relative abundance of species. The American Naturalist, 94(874):25–36, 1960.
- Mac57
Robert H MacArthur. On the relative abundance of bird species. Proceedings of the National Academy of Sciences, 43(3):293–295, 1957.
- MEG+07(1,2,3,4,5,6,7,8)
Brian J McGill, Rampal S Etienne, John S Gray, David Alonso, Marti J Anderson, Habtamu Kassa Benecha, Maria Dornelas, Brian J Enquist, Jessica L Green, Fangliang He, and others. Species abundance distributions: moving beyond single prediction theories to integration within an ecological framework. Ecology letters, 10(10):995–1015, 2007.
- Mot32
Isao Motomura. A statistical treatment of ecological communities. Zoological Magazine, 44:379–383, 1932.
- Pre48(1,2,3)
Frank W Preston. The commonness, and rarity, of species. Ecology, 29(3):254–283, 1948.
- Sug80
George Sugihara. Minimal community structure: an explanation of species abundance patterns. The American Naturalist, 116(6):770–787, 1980.
- Whi75
RH Whittaker. Communities and ecosystems, 2nd edn macmillan publishing company. New York, NY, 1975.
- Whi65
Robert H Whittaker. Dominance and diversity in land plant communities: numerical relations of species express the importance of competition in community function and evolution. Science, 147(3655):250–260, 1965.