Electricity Markets Under Uncertainty#
Part of a series: Uncertainty in Future Energy Systems.
Follow reading here
Integrating large shares of fluctuating renewable power sources (i.e. solar and wind) is a major challenge in the transition towards a sustainable energy system. To balance the variable power generation, short-term trading on the electricity market is becoming increasingly important. Due to the inherent connection with different sources of uncertainty, such as the stochastic nature of the weather or electricity demand, the electricity price has interesting stochastic features that are examined in [Han et al., 2022]. In this study, different electricity price time series of the day-ahead and the intraday market were analysed. These price time series describe products that are traded at the German and Austrian Electricity Market (EPEX SPOT).
While contracts at the day-ahead market are agreed upon up until noon before the day of delivery, contracts at the intraday market are traded continuously until minutes before the delivery. The intraday market serves to clear remaining imbalances that are mainly due to the inherent uncertain production of fluctuating renewable production by solar and wind resources and the associated forecasting errors. To better deal with these uncertainties, shorter term quarter-hourly trading blocks were introduced in recent years [EPEX SPOT SE, 2020].
To investigate the fluctuations on short time scales, periodicities and other long-term trends were removed via empirical modes decomposition [Huang et al., 1998]. Empirical mode decomposition is a model-free detrending method that separates the original signal into different intrinsic mode functions and is especially useful when dealing with non-stationary and non-periodic trends. Substracting the three lowest intrinsic mode functions and examining the probability density functions (see Distribution Functions) shows that there are large deviations from the average price \(p\) for all three considered price time series, which is highlighted by a large kurtosis \(\kappa\) (see Expected Value, Variance and Higher Moments for details) indicating the presence of heavy tails. The pronounced heavy tails beg the question which statistics should be used to describe the price dynamics accurately. Choosing Lévy \(\alpha\)-stable distributions [Mandelbrot, 1960] and q-Gaussian distributions [Tsallis, 1988] as possible candidates, the more likely type of distribution for the observed price data was determined. The lines in Fig. 60 show a fit of both distributions to the data. While both distributions seem to visually fit the observed price data, the better fit to the price data is given by the q-Gaussian distribution. This was validated by using the Kullback-Leibler divergence [Kullback and Leibler, 1951] that gives the difference between two probability distributions.
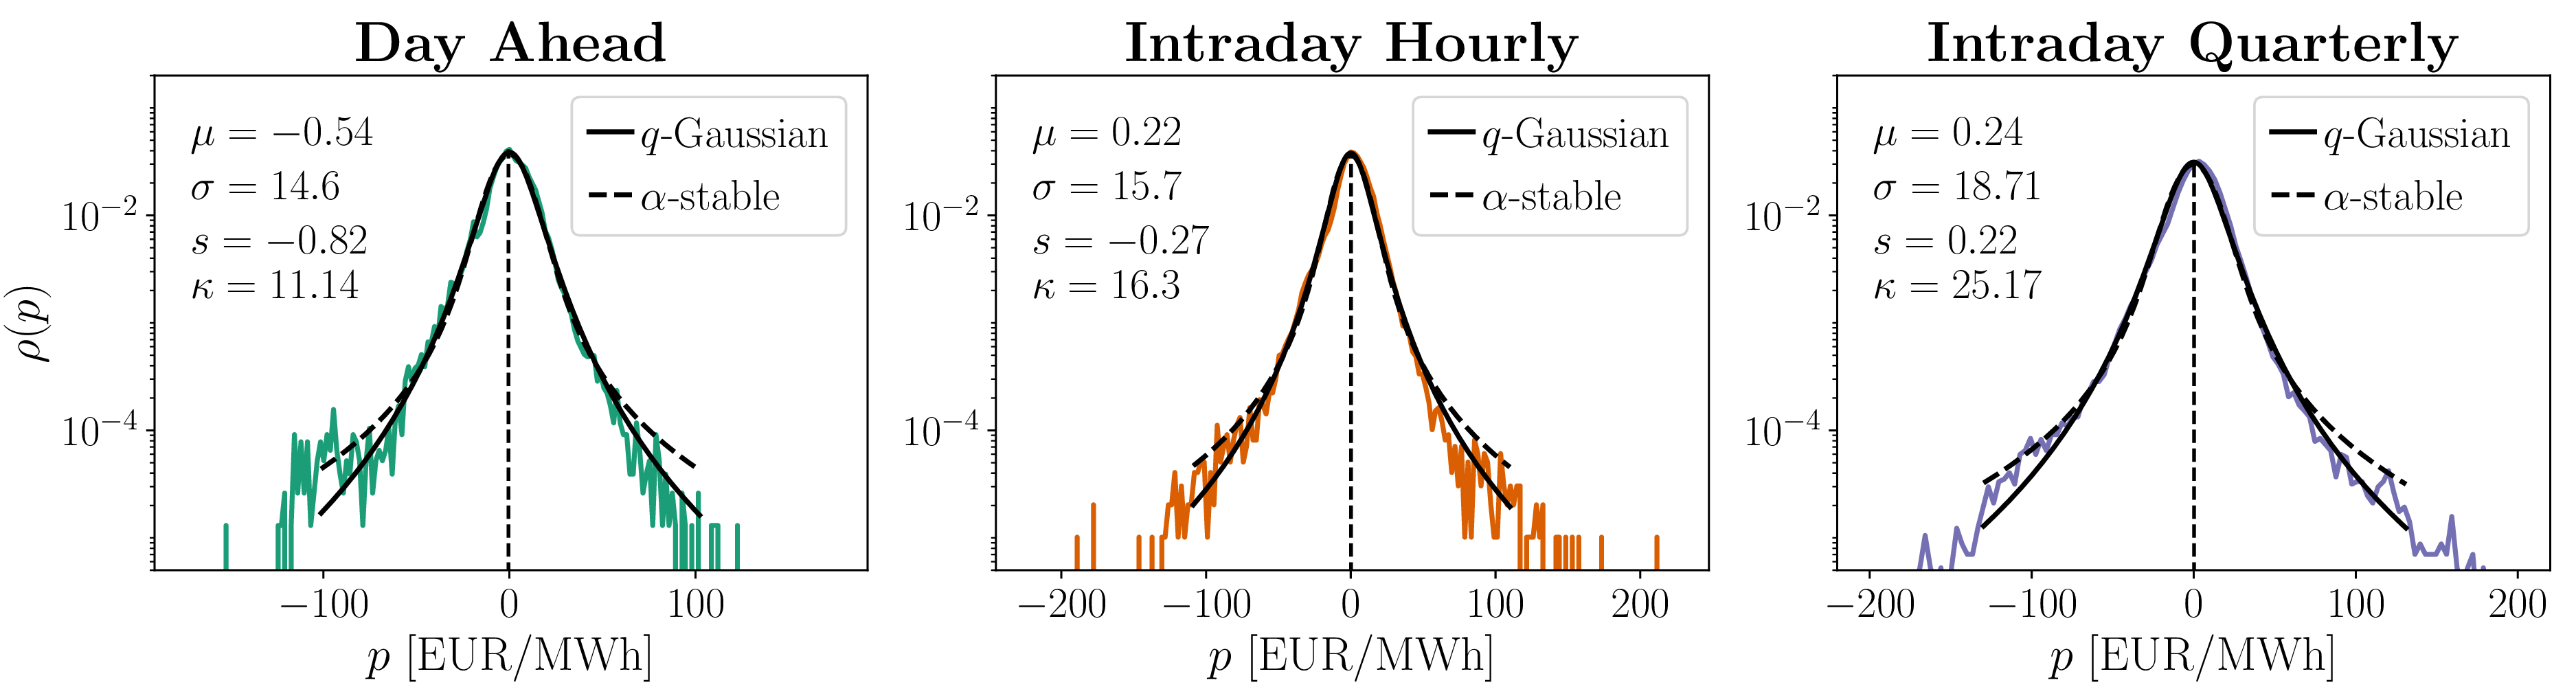
Fig. 60 Empirical distributions of the detrended price time series. Lines represent fits with a q-Gaussian and an \(\alpha\)-stable distribution. Mean \(\mu\), standard deviation \(\sigma\), skewness \(s\), and kurtosis \(\kappa\) can be seen in in each figure. The figure is taken from [Han et al., 2022].#
Another interesting statistical features are correlations in the dynamics of the time series. To study the correlations on different time scales, we can use the Hurst exponent \(H\) [Hurst, 1951]. The Hurst exponent of uncorrelated Brownian motion (see Wiener process for the corresponding stochastic process) is \(H=0.5\), which roughly corresponds to the fact that the variance scales with time with an exponent of \(H=0.5\). A value of \(H > 0.5\) indicates persistent dynamics, i.e. a change in the time series is most likely followed by a change in the same direction. A value \(H < 0.5\) indicates antipersistent dynamics, i.e. a change time series is most likely followed by a change in the opposite direction. The Hurst exponent \(H\) was estimated by employing multifractal detrended fluctuation analysis (MFDFA) [Gorjão et al., 2022] which examines the fluctuations around a smooth trend. To this end, one defines a fluctuation function \(F_{q}(r)\) that measures the variance of different non-overlapping segments of size \(r\) (see [Han et al., 2022] for details). Using \(F_{q=2}(r) \propto r^H\), the Hurst exponent \(H\) was approximated (see Fig. 61). All markets display anti-correlated, i.e. antipersistent, dynamics for time scales larger than 12 h. Interestingly, the hourly price times series for both the day-ahead and the intraday market, display correlated, i.e. persistent, dynamics for time scales smaller than 12 h, while the persistence does not change noticeably for the quarter-hourly intraday market for different time scales. The observed correlations are far stronger than in other markets, such as stock or exchange markets.
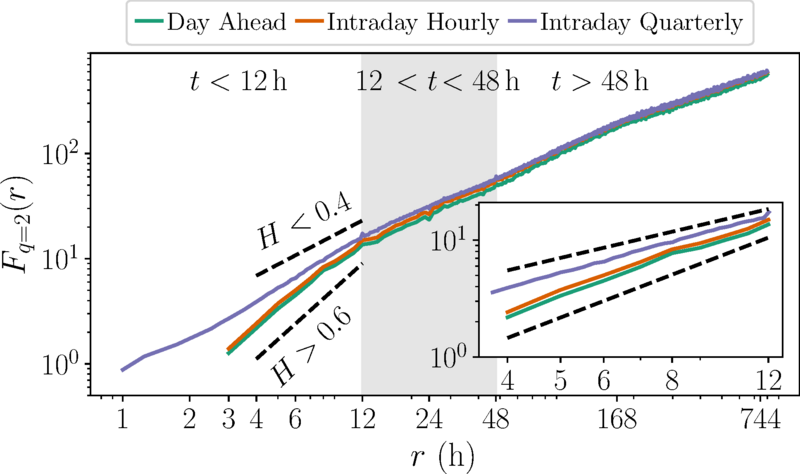
Fig. 61 Fluctuation function \(F_{q=2}(r)\) of the three price time series on a double-logarithmic plot. By fitting the curves we can extract the Hurst exponent \(H\). One recognizes the change from persistence to antipersistence at the 12 h mark, which is present for the hourly market but not the quarter-hourly market. The figure is taken from [Han et al., 2022].#
The most prominent renewable generation facilities, namely solar and wind resources, rely on the weather. Hence, one expects that large-scale weather patterns affect both averages and fluctuations in electricity markets. To characterize the large-scale weather situation, one can characterize the weather using the circulation weather type method [Jones et al., 1993]. Here, measurements around a central point are used to classify the mean sea level pressure field into different directional flows and different rotational weather types. Subsequently, the \(f\)-parameter is calculated, which summarizes the strength of the flows to a single value. Low \(f\)-parameter values are assigned to weak gradients and high values are assigned to strong gradients. As a pressure gradient causes wind, the \(f\) parameter is a proxy for the large-scale wind power resources in Central Europe. By conditioning the price time series on the hourly \(f\)-parameter and evaluating the stochastic features of the price time series at this \(f\)-parameter, the influence of the weather on the price time series can be quantified (Fig. 62). One can immediately see a trend in the mean \(\mu\) and skewness \(s\) of the condition distributions. Larger values of \(f\) display a lower mean \(\mu\) and skewness \(s\). This indicates that, under calm wind conditions, elevated average prices with a skewed distribution towards high price events occur. In contrast, high pressure gradients and the associated strong surface winds result in reduced average prices with a skewed distribution towards negative price events. Additionally, the standard deviation \(\sigma\) increases slightly and the kurtosis \(\kappa\) decreases slightly for larger values of \(f\).
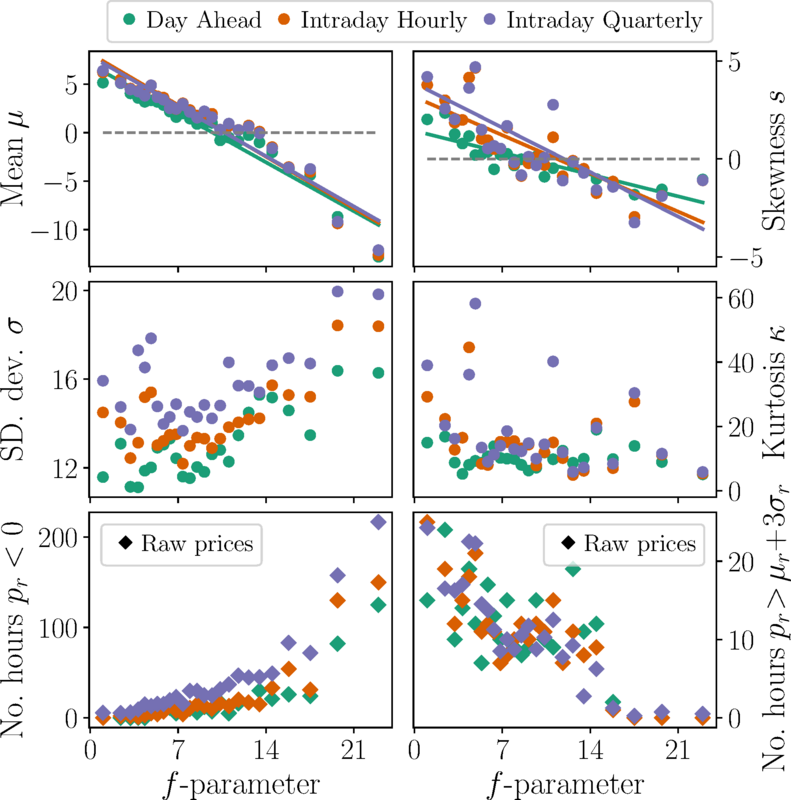
Fig. 62 Impact of large-scale weather regimes on the statistics of electricity prices. By evaluating the statistical properties of the detrended time series at times where a specific \(f\)-parameter was evaluated, the behavior at different large-scale weather situations can be assessed. This is shown in the panels in the top and middle row. Low \(f\)-parameters (i.e., weak winds) are associated with high mean prices \(\mu\), positive skewness \(s\), small standard deviations \(\sigma\) and a typically larger kurtosis \(\kappa\). Additionally, there are fewer number of hours with negative prices and a maximum number of relatively high prices (i.e., prices higher than 3 standard deviation away from the mean of the raw data) events at low \(f\)-parameters (see bottom panels), which was evaluated for the raw price times series. For larger \(f\)-parameters (i.e., strong winds), the mean \(\mu\) and the skewness \(s\) become negative, the standard deviation \(\sigma\) increases, and the kurtosis \(\kappa\) becomes somewhat smaller. Also there are more hours with negative prices and the high prices events vanish. The figure is taken from [Han et al., 2022].#
In summary, price time series of three important electricity markets were analyzed. Suitable distribution function candidates for the detrended price time series were determined. Subsequently, the correlations at different time-scales, i.e., the persistence of the time series, was investigated. While we see a change from persistent to anti-persistent behavior of the electricity price time series of markets dealing hourly products, the price time series of markets that trade quarter-hourly products remains anti-persistent for the considered time-scales. Lastly, the connection between the statistical properties of the price time series and large-scale weather patterns was examined, which highlighted that the available wind power resource is correlated with the electricity price statistics.
While this work serves as an important step to describe, interpret and find a physical explanation for the stochastic and statistical properties of electricity price time series, it should be noted that electricity markets are influenced by a multitude of sources of uncertainty (e.g., changing price of energy and fuel or regulatory issues). Their influence on the electricity prices is not explicitly treated here but should be treated in future works to gain a comprehensive understanding of how electricity prices behave.
A deeper analysis, which also focuses on the multi-fractal nature of the data, and additional details on the used methods can be found in [Han et al., 2022].
References#
- GorjaoHKW22
Leonardo Rydin Gorjão, Galib Hassan, Jürgen Kurths, and Dirk Witthaut. Mfdfa: efficient multifractal detrended fluctuation analysis in python. Computer Physics Communications, 273:108254, 2022.
- HHM+22(1,2,3,4,5,6)
Chengyuan Han, Hannes Hilger, Eva Mix, Philipp C Böttcher, Mark Reyers, Christian Beck, Dirk Witthaut, and Leonardo Rydin Gorjão. Complexity and persistence of price time series of the european electricity spot market. PRX Energy, 1(1):013002, 2022.
- HSL+98
Norden E Huang, Zheng Shen, Steven R Long, Manli C Wu, Hsing H Shih, Quanan Zheng, Nai-Chyuan Yen, Chi Chao Tung, and Henry H Liu. The empirical mode decomposition and the hilbert spectrum for nonlinear and non-stationary time series analysis. Proceedings of the Royal Society of London. Series A: mathematical, physical and engineering sciences, 454(1971):903–995, 1998.
- Hur51
Harold Edwin Hurst. Long-term storage capacity of reservoirs. Transactions of the American society of civil engineers, 116(1):770–799, 1951.
- JHB93
PD Jones, M Hulme, and KR Briffa. A comparison of lamb circulation types with an objective classification scheme. International Journal of Climatology, 13(6):655–663, 1993.
- KL51
Solomon Kullback and Richard A Leibler. On information and sufficiency. The annals of mathematical statistics, 22(1):79–86, 1951.
- Man60
Benoit Mandelbrot. The pareto-levy law and the distribution of income. International economic review, 1(2):79–106, 1960.
- Tsa88
Constantino Tsallis. Possible generalization of boltzmann-gibbs statistics. Journal of statistical physics, 52:479–487, 1988.
- EPEXSSE20
EPEX SPOT SE. Market integration of renewables – mission accomplished? 2020. URL: https://www.epexspot.com/sites/default/files/download_center_files/202009_Market integration of renewables.pdf (visited on 08.12.2022).
Contributors#
Sonja Germscheid, Dirk Witthaut, Jan Freund, and Frederik Tilmann