Dimensionality Reduction in Load-Frequency Control#
Part of a series: Uncertainty in Future Energy Systems.
Follow reading here
Electric power is commonly transmitted and distributed via alternating current (AC) grids: The current and voltage oscillate with a frequency that is almost exactly the same throughout the entire grid. The frequency is typically very close to its reference value (e.g, 50Hz in Europe or 60Hz in the US), where small deviations are essential observables in power system monitoring and control. Those deviations arise due to imbalances of generated and consumed electricity. A surplus of power or a surplus of demand leads to a higher and lower frequency, respectively. The grid frequency is thus a central measurement variable in the European electricity grid. The speed of its dynamics, the so-called Rate of Change of Frequency(RoCoF), is linked to the amount of inertia that is available in the power system. Inertia is provided by large rotating generator masses that are mostly used in conventional generation (e.g., gas turbines or coal power plants). Thus, the dynamics of the grid frequency is coupled to the dynamics of theses generators. If a change of frequency occurs, the rotational speed of the generator masses changes and this change in rotational energy opposes any change in grid frequency and thus stabilizes the system. If we neglect small frequency differences throughout the power grid, we can write the grid frequency dynamics of the entire grid as
with the frequency deviation \(f\), the inertia constant \(H\), the rated power of generators that are synchronously coupled to the grid \(S_B\), the reference frequency \(f_0\), the damping constant \(D\) and the power imbalance \(\Delta P\).
Furthermore, the relationship between load imbalances and grid frequency deviations enables the grid operators to react within seconds to a contingency (e.g., a failure of a generator). Since the grid operators know how the size of an imbalance is connected to the size of a power imbalance, they can reestablish the balance by providing control power. This stops the grid frequency from changing and stabilizes the grid frequency at a value different than the desired reference frequency. Subsequently, reestablishing the desired operating state requires detailed measurements of the state of the power system like the power flows between different regions. These measurements are necessary to identify the location of the disturbance and to employ intricate control mechanisms that bring the frequency back to the reference value and restore the power flows to the scheduled values. While this requires different control mechanisms that each fulfill a part of the overarching goal of reestablishing a desired operating state, containing the frequency disturbance and preventing it from exceeding a critical threshold can be achieved by reacting only to the measured grid frequency deviation.
In summary, the power grid frequency is influenced by many different factors that are both deterministic (e.g., imbalances in generation and load, and control) and random (e.g., power generation by fluctuating renewables) in nature, its dynamics can be seen as a stochastic process that describes the current state of the power system. Analyzing the frequency at a single measurement location already reveals interesting stochastic features, such as its non-gaussianity [Schäfer et al., 2018] or non-linear effects [Anvari et al., 2020].
Investigating not only a single measurement but multiple synchronous measurements at different locations reveals a multitude of spatio-temporal periodic patterns. One important type of patterns are inter-area modes which result from groups of machines located in different regions of the grid that change their frequency together, leading to synchronized oscillatory behavior of groups of machines. To understand these and other patterns, one needs to decompose the signal. To this end, a sophisticated measurement system is needed, which enables simultaneous measurements with high resolution in time and space.
Given a data set that adequately covers the different regions of the power grid and has a sufficient temporal resolution, one can employ Principal Component Analysis (PCA) to disentangle these spatio-temporal patterns. Principal Component Analysis is a commonly used method to reduce the complexity of high-dimensional data sets by finding a new coordinate system (i.e, principal components) that describes most of the observed variations in the original data while using fewer dimensions [Abdi and Williams, 2010]. Thus the grid frequency \(f(x, t)\) at location \(x\) and time \(t\) is decomposed as
where \(A_i(t)\) are the time dependent amplitudes, \(v_i(x)\) are the spatial principal components (PCs), \(n\) is the number of locations and \(\langle f \rangle\) is the average of the frequency recordings over time. This decompositions presupposed that the process is stationary and ergodic. The principal components of \(v_i\) are given by the eigenvectors of the covariance matrix of the frequency time series and are the spatial patterns of interest. The associated eigenvalues \(\lambda_i\) show how much of the variability of the data set is explained by the corresponding principal component \(v_i\). Generally, the eigenvalues are sorted in descending order to sort the principal components in terms of the explained variability. We will not reconstruct the frequency signal using fewer PCs but reduce the dimension of the grid frequency by investigating the first few PCs and identifying them with important spatio-temporal patterns. Analyzing the amplitudes \(A_i(t)\) provides insights into the temporal behavior of the patterns associated with each PC. For example, they can be used to understand how the different patterns correlate over time and to understand how specific events (e.g. interconnection of previously non-synchronous regions or failure of relevant transmission elements) affect the relative importance of different spatial patterns.
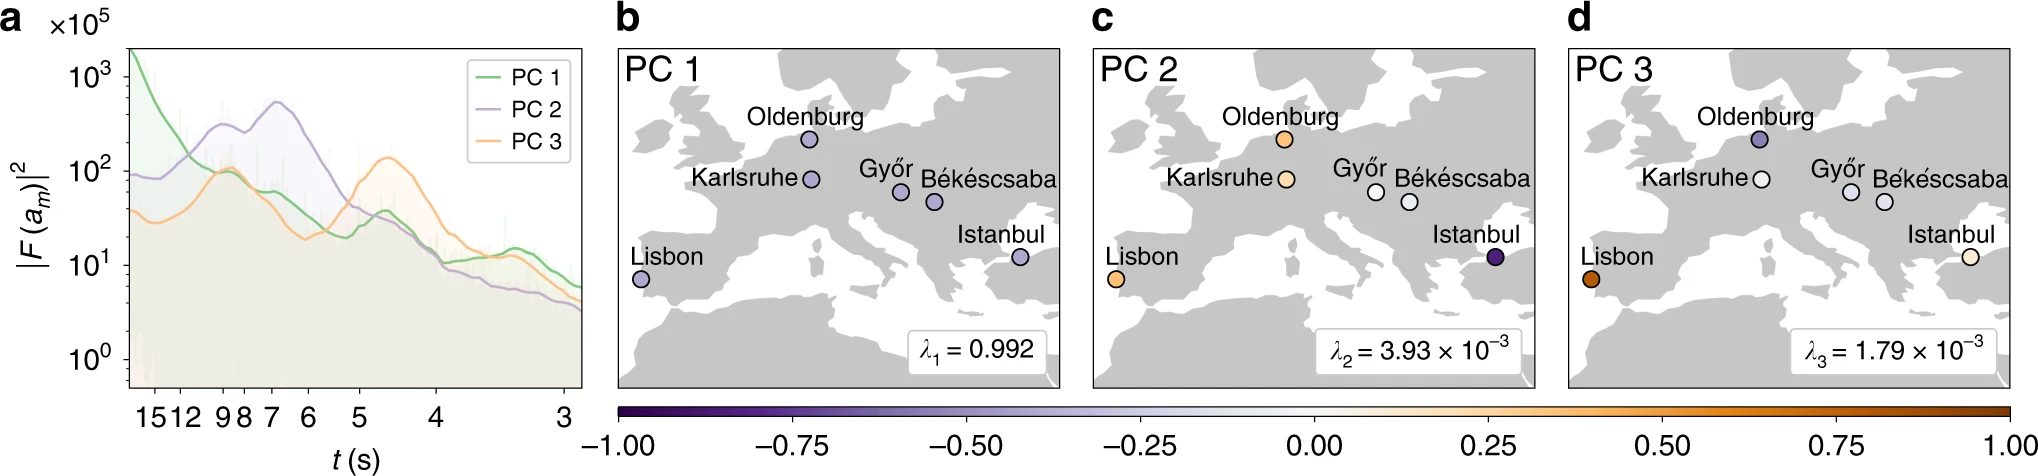
Fig. 59 First three dominant principal component (PCs) in panel b-c and their Power Spectrum in panel a of the grid frequency recorded at the five marked locations taken from [Gorjão et al., 2020].#
An example of a PCA analysis of the grid frequency recorded at five measurement locations is shown in Fig. 59. While the first PC (see Panel b in Fig. 59) represents the synchronous oscillation with the reference frequency, the next PCs show the asynchronous oscillation of different regions of grid. The first principal component describes already around 99% of the observed variance, indicating that most of the variance is given by the synchronous oscillation. Nevertheless, the asynchronous modes are also interesting since they describe how different regions interact with each other. One can identify an East-West mode and a North-South mode which is associated with PC2 and PC3, respectively. Additionally, one can investigate the time scales of variation in the inter-area oscillations by examining the power spectrum of the amplitudes \(A_i(t)\). The power spectrum can be evaluated by finding the Fourier transform of the amplitudes \(\tilde{A}_t(\omega)\) (i.e., the squared Fourier amplitudes \(|\tilde{A}_i(\omega)|^2\)), which for example shows that the East-West inter-area oscillation PC2 occurs with a period of \(T\approx 7\)s.
Subsequently, the disentangled frequency signal can be analyzed together with other power system data. For example, one could find how the \(A_i(t)\) are correlated with different types of power generation to gain deeper insight into the dynamics of the power system.
References#
- AW10
Hervé Abdi and Lynne J Williams. Principal component analysis. Wiley interdisciplinary reviews: computational statistics, 2(4):433–459, 2010. doi:10.1002/wics.101.
- AGorjaoT+20
Mehrnaz Anvari, Leonardo Rydin Gorjão, Marc Timme, Dirk Witthaut, Benjamin Schäfer, and Holger Kantz. Stochastic properties of the frequency dynamics in real and synthetic power grids. Physical review research, 2(1):013339, 2020.
- GorjaoJM+20
Leonardo Rydin Gorjão, Richard Jumar, Heiko Maass, Veit Hagenmeyer, G Cigdem Yalcin, Johannes Kruse, Marc Timme, Christian Beck, Dirk Witthaut, Benjamin Schäfer, and others. Open database analysis of scaling and spatio-temporal properties of power grid frequencies. Nature Communications, 11(1):1–11, 2020.
- SchaferBA+18
Benjamin Schäfer, Christian Beck, Kazuyuki Aihara, Dirk Witthaut, and Marc Timme. Non-gaussian power grid frequency fluctuations characterized by lévy-stable laws and superstatistics. Nature Energy, 3(2):119–126, 2018.
Contributors#
Sonja Germscheid, Dirk Witthaut, Frederik Tilmann, and Jan Freund