Data Sources for Energy Systems Analysis#
Part of a series: Uncertainty in Future Energy Systems.
Follow reading here
Energy system research relies on data from a wide range of sources ranging from data describing the physical state of the system (e.g., delivered power or balancing power), market data (e.g., electricity and gas prices) to other socio-economic data.
These different data sets have inherently different temporal and spatial resolutions.
For example, the aggregated power generation of each country in Europe is provided by the European Network of Transmission System Operators for Electricity (ENTSO-E) in at most quarter-hourly resolution, which corresponds to the time windows of the generation schedules traded at the electricity markets.
Since the requirements of the data depend on the specific research question, one has to be wary of the availability of data sets.
If these requirements are not met by the available data, it might be necessary to modify the research question accordingly.
In the following article, data sources and the corresponding research questions are discussed to give an idea which data is available.
Power Grid Frequency#
If one wants to perform stochastic analysis to quantify not only apparent deterministic trends but also the underlying stochasticity, data with a sufficiently high time resolution is needed. One example of data that has been used to examine the stochastic processes in power system is the grid frequency. It is a central quality measure for the state of a power system and can for example be used to quantify the control mechanisms of the power grid [Gorjão et al., 2020] or to investigate feed-in of fluctuating generation like feed-in by wind turbines [Haehne et al., 2018]. While measurements of the grid frequency can be downloaded from various transmission system operators, these data sets are often lacking both sufficient resolution and quality. To alleviate this, [Jumar et al., 2020] compiled a comprehensive collection of the available data that also includes data from various measurement campaigns. This overview can be accessed at https://power-grid-frequency.org/ and a short power grid frequency time series can be seen in Fig. 50.
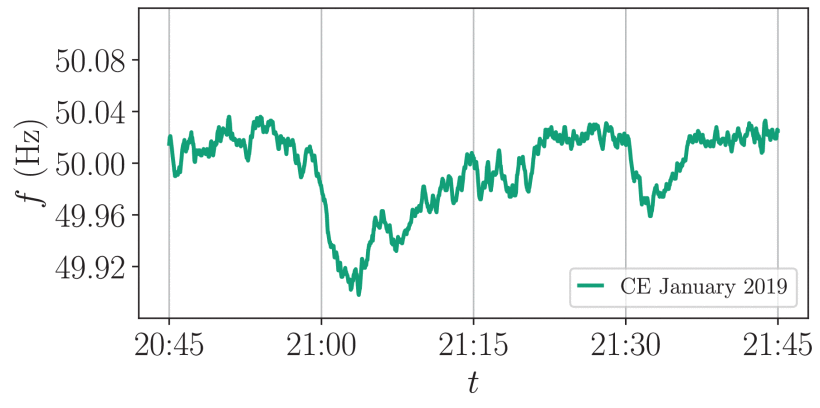
Fig. 50 Power grid frequency \(f\) over time \(t\) using data that was measured on the 10th of January 2019 in the Central European power grid. The data was provided by the transmission system operator TransNetBW. This plot was taken from [Gorjão et al., 2020].#
There is also spatially distributed data which includes around 30 measurement stations in Continental Europe that measure synchronously (see https://gridradar.net).
This data set can be used to investigate for example the propagation of disturbances in the grid frequency or the existence of characteristic periodic patterns (see Dimensionality Reduction in Load-Frequency Control).
Furthermore, one can examine how these spatial features of the grid frequency compares before and after a major change in the power systems such as the emergency interconnection of the Ukrainian grid in March of 2022 [Böttcher et al., 2023].
Power Generation#
Time series of renewable power generation are typically derived from weather data, in particular wind velocities and solar irradiation. Weather forecasts are essential in applications. For instance, electricity trading is mostly done in day-ahead markets using day-ahead forecasts of renewable power generation (see Electricity Markets Under Uncertainty). During the last decade, energy meteorology emerged as a new subdiscipline in the geosciences [Ahmed et al., 2020, Emeis, 2018]. A particular challenge in this area is the prediction of wind power ramp events and their timing [Gallego-Castillo et al., 2015]. Energy system analysis and modeling typically use historical weather data, more precisely, reanalysis datasets [Dee et al., 2011, Staffell and Pfenninger, 2016]. Reanalysis data is based on numerical models and weather observations, including, for example, temperature or atmospheric pressure time series. To fill the spatial and temporal gaps in the data and obtain a consistent data set ranging a long period of time that can be used for further analysis (e.g., in energy systems analysis), one integrates short-range weather forecast models and observations through data assimilation. Since this approach uses both measurement data as well as numerical methods for weather prediction, one has to be aware of both measurement uncertainty (e.g, by diverse methods of observation that changed over time) and by the description uncertainty introduced by the numerical weather prediction models. The use of reanalysis in energy system models is discussed in detail in [Collins et al., 2018]. Alternatively, one may resort to synthetic scenarios from generative models (see Scenario Generation and Validation in Renewable Power Generation).
Another very useful resource is the ENTSO-E transparency platform available at https://transparency.entsoe.eu/.
This data is collected from the Transmission System Operators which are companies that operate the power grids in the different countries in Europe.
The platform contains various data sets that describe the state of the European power system.
For example, data sets that describe the demand, the generation and the transmission of power.
Additionally, it supplies data on balancing, outages and congestion management.
It can be accessed via the website, an API or an sftp-interface.
While this platform offers a wide range of data sets, the available resolution is typically 1 hour.
Electricity Market#
Besides data that describe the physical aspects of the power system, one can also analyse electricity market data.
A valuable resource is found at https://www.energy-charts.info which is operated by the Fraunhofer ISE and provides data from the European Power Exchange markets.
While this data is not openly available, it can be purchased and contains all relevant data regarding the German energy markets.
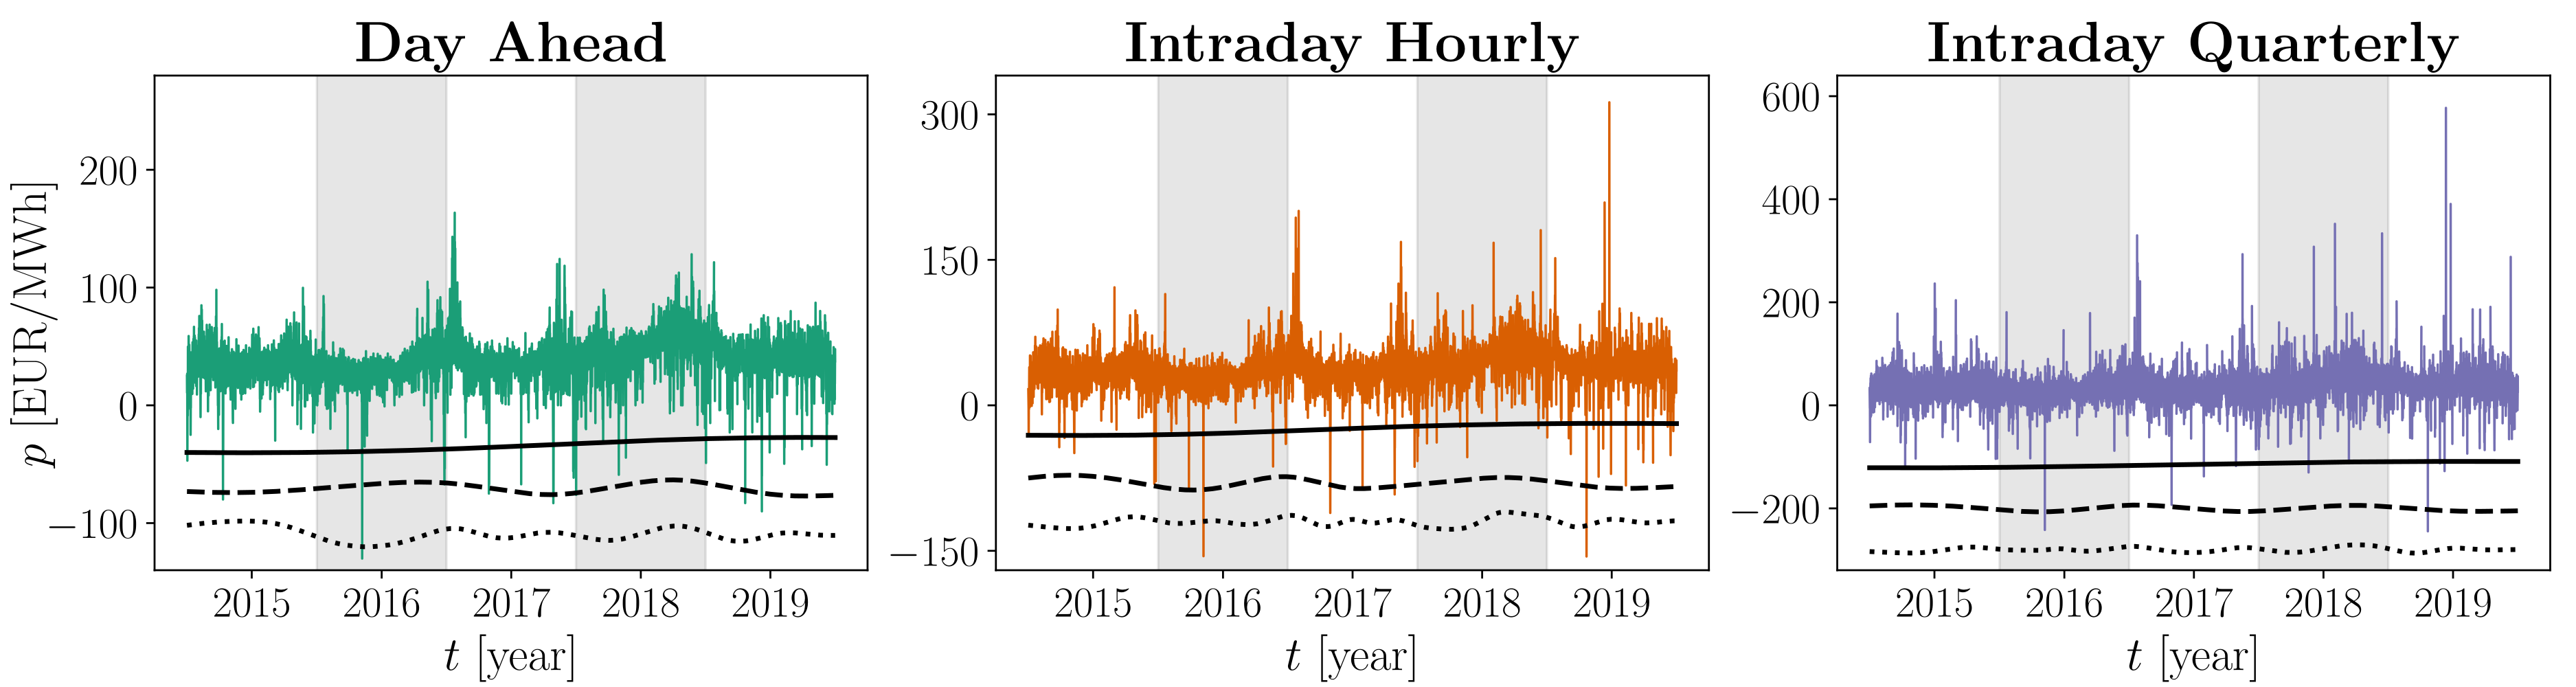
Fig. 51 Time series of the electricity price \(p\) of three different markets traded at the European power exchange. The black lines show the first three intrinsic mode functions that indicate the long-term non-stationary behavior. This figures is taken from [Han et al., 2022].#
The time series of electricity price of the day-ahead, intraday hourly and intraday quarter-hourly markets are shown in Fig. 51. A closer examination of these time series is described in Electricity Markets Under Uncertainty, which contains the results that are presented in [Han et al., 2022].
Socio-Economic#
Additionally, one might be interested in social data on the level of households.
For example, this can be used to investigate how the use of a specific technology, e.g. heat-pumps or electric vehicles, is connected to social features such as the unemployment rate or the level of education.
A data set that is freely available and contains a wide range of information can be accessed at https://inkar.de. The data set is provided by the Bundesinstituts für Bau-, Stadt- und Raumforschung for several years.
Power Grid Structure#
If one is more interested in employing dynamic simulations of the power grid, one has to know the makeup of the energy system. A comprehensive model can be downloaded at this Zendo archive.
A visualization of this network can be seen in Fig. 52. It was designed to study the propagation of disturbances in the European transmission grid.
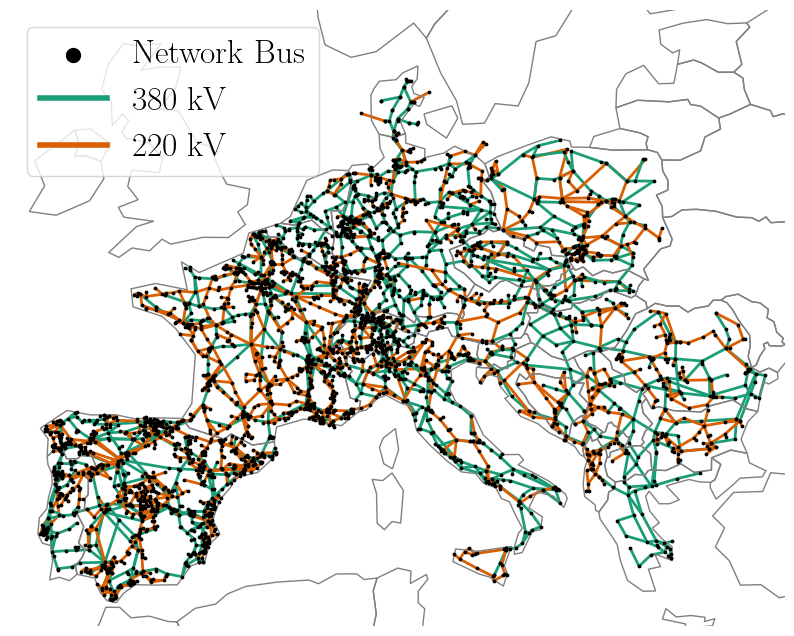
Fig. 52 Model of the European transmission system provided by PanTaGruEl.#
Openmod Wiki#
Note, this was a short list to give a first impression of which data sets are available in the field of energy systems research. For a more detailed list, we refer to openmod-wiki which also discusses the various energy systems models. This resource is especially useful since it focuses on openly available data sets and models that are correctly licensed to enable researches to use them freely.
References#
- ASMA20
Razin Ahmed, V Sreeram, Y Mishra, and MD Arif. A review and evaluation of the state-of-the-art in pv solar power forecasting: techniques and optimization. Renewable and Sustainable Energy Reviews, 124:109792, 2020.
- BottcherGorjaoB+23
Philipp C Böttcher, Leonardo Rydin Gorjão, Christian Beck, Richard Jumar, Heiko Maass, Veit Hagenmeyer, Dirk Witthaut, and Benjamin Schäfer. Initial analysis of the impact of the ukrainian power grid synchronization with continental europe. Energy Advances, 2(1):91–97, 2023.
- CDGallachoir+18
Seán Collins, Paul Deane, Brian Ó Gallachóir, Stefan Pfenninger, and Iain Staffell. Impacts of inter-annual wind and solar variations on the european power system. Joule, 2(10):2076–2090, 2018.
- DUS+11
Dick P Dee, S Mꎬ Uppala, Adrian J Simmons, Paul Berrisford, Paul Poli, Shinya Kobayashi, U Andrae, MA Balmaseda, G Balsamo, d P Bauer, and others. The era-interim reanalysis: configuration and performance of the data assimilation system. Quarterly Journal of the royal meteorological society, 137(656):553–597, 2011.
- Eme18
Stefan Emeis. Wind energy meteorology: atmospheric physics for wind power generation. Springer, 2018.
- GCCTLG15
Cristobal Gallego-Castillo, Alvaro Cuerva-Tejero, and Oscar Lopez-Garcia. A review on the recent history of wind power ramp forecasting. Renewable and Sustainable Energy Reviews, 52:1148–1157, 2015.
- GorjaoAK+20(1,2)
Leonardo Rydin Gorjão, Mehrnaz Anvari, Holger Kantz, Christian Beck, Dirk Witthaut, Marc Timme, and Benjamin Schäfer. Data-driven model of the power-grid frequency dynamics. IEEE access, 8:43082–43097, 2020.
- HSW+18
Hauke Haehne, Jannik Schottler, Matthias Waechter, Joachim Peinke, and Oliver Kamps. The footprint of atmospheric turbulence in power grid frequency measurements. Europhysics Letters, 121(3):30001, 2018.
- HHM+22(1,2)
Chengyuan Han, Hannes Hilger, Eva Mix, Philipp C Böttcher, Mark Reyers, Christian Beck, Dirk Witthaut, and Leonardo Rydin Gorjão. Complexity and persistence of price time series of the european electricity spot market. PRX Energy, 1(1):013002, 2022.
- JMaassSchafer+20
Richard Jumar, Heiko Maaß, Benjamin Schäfer, Leonardo Rydin Gorjão, and Veit Hagenmeyer. Database of power grid frequency measurements. arXiv preprint arXiv:2006.01771, 2020.
- SP16
Iain Staffell and Stefan Pfenninger. Using bias-corrected reanalysis to simulate current and future wind power output. Energy, 114:1224–1239, 2016.
Contributors#
Dirk Witthaut, Sonja Germscheid, Annette Möller, and Sebastian Krumscheidt